
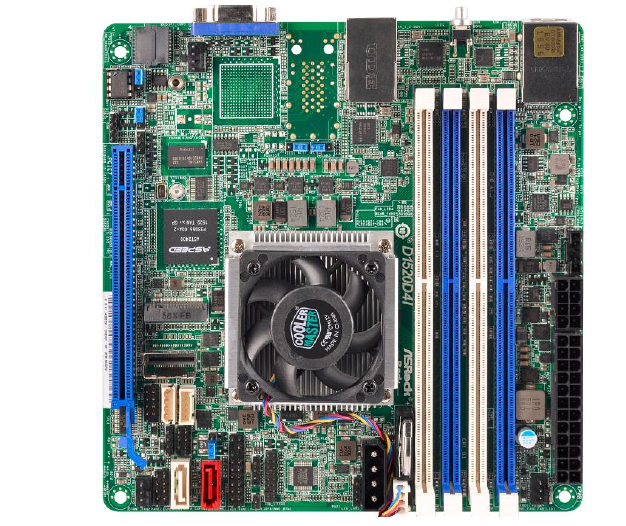
ASRock Rack Launches Xeon D Motherboards
The Xeon D family currently consists of two members:
- Xeon D-1520 : 4C/8T Broadwell-DE x86 cores @ 2.2 GHz, 6 MB of L2 cache, 45W TDP
- Xeon D-1540 : 8C/16T Broadwell-DE x86 cores @ 2.0 GHz, 12 MB of L2 cache, 45W TDP
ASRock Rack's Xeon D lineup consists of one board using the Xeon D-1520 and six boards using the Xeon D-1540. Customers have the option of going with either the mini-ITX (mITX) form factor or the micro-ATX (uATX) form factor. The mITX boards are all compatible with 1U rackmount chassis.


In addition to the motherboard size, the differentiation aspects come in the form of support for different varieties of LAN ports, PCIe slot configurations, additional storage ports using the LSI 3008 HBA and different USB 3.0 port configurations. Unlike the mITX boards, all the uATX boards come with a COM port in the rear I/O.The following tables summarize the features of the various products in the ASRock Rack Xeon D lineup.
mITX Boards
| D1520D4I | D1540D4I | D1540D4I-2L2T | |||
| SiP | Intel Xeon D-1520 | Intel Xeon D-1540 | |||
| RAM | 4x DDR4 DIMM Slots 2133 / 1866 MHz RDIMMs (Up to 128 GB) | ||||
| PCIe Expansion Slots | 1x PCIe 3.0 x16 | ||||
| Storage Controllers | 6x SATAIII 6 Gbps from integrated PCH in the Xeon D SiP (4x via mini-SAS connector) (1x with SATA DOM support) |
||||
| 1x SATAIII 6 Gbps from Marvell 9172 (via M.2 2280 interface) |
|||||
| LAN Controllers | 2x RJ45 1GbE (Intel i210) |
2x RJ45 1GbE (Intel i210) |
|||
| 2x RJ45 10GbE (Intel X557-AT2) |
|||||
| Board Management Controller | ASPEED AST2400 | ||||
| IPMI LAN Controller | 1x Realtek RTL8211E | ||||
| Display Output | 1x D-Sub VGA | ||||
| USB Ports | 2x USB 3.0 Type-A (Rear I/O) | ||||
uATX Boards
| D1540D4U-2T8R | D1540D4U-2O8R | D1540D4U-2T2O8R | D1540D4U-2L+ | |
| SiP | Intel Xeon D-1540 | |||
| RAM | 4x DDR4 DIMM Slots 2133 / 1866 MHz RDIMMs (Up to 128 GB) | |||
| PCIe Expansion Slots | 1x PCIe 3.0 x8 (x16 physical) | 1x PCIe 3.0 x16 | ||
| 1x PCIe 3.0 x8 (x8 physical) | 1x PCIe 3.0 x8 | |||
| Storage Controllers | 6x SATAIII 6 Gbps from integrated PCH in the Xeon D SiP (4x via mini-SAS connector) (1x with SATA DOM support) |
|||
| 8x SAS3 12Gbps from LSI 3008 HBA (via mini-SAS HD connector) |
||||
| 1x SATAIII 6 Gbps from Marvell 9172 (via M.2 2280 interface) |
||||
| LAN Controllers | 2x RJ45 10GbE (Intel X550) |
2x 10G SFP+ Fiber | 2x 10G SFP+ Fiber | 2x RJ45 1GbE (Intel i350) |
| 2x RJ45 10GbE (Intel X540) |
||||
| Board Management Controller | ASPEED AST2400 | |||
| IPMI LAN Controller | 1x Realtek RTL8211E | |||
| Display Output | 1x D-Sub VGA | |||
| USB Ports | 2x USB 3.0 Type-A (Rear I/O) | |||
| 1x USB 3.0 Type-A (Internal Connector) | ||||
| 1x USB 3.0 Header | ||||
These boards are ideal for network and warm storage devices as well as micro-servers. Given the low power nature of the Xeon D platform, some of them can also be useful in home lab settings for experimenting with virtualization or even act as boards for high-end development machines.
Read More ...
QNAP TS-451+ SOHO NAS Review
QNAP is one of the leading vendors in the COTS NAS (commercial off-the-shelf network attached storage) space. They have a wide variety of hardware platforms to choose from, ranging from ARM-based single-bay systems to Xeon-based rackmounts. Earlier this week, they launched the Bay Trail-based TS-x51+ series for home and SOHO users. We have the 4-bay variant, the TS-451+ in for review. Read on to see how the unit stacks up against the competitors in this space.
Read More ...
Behind The Scenes: Evaluating NAS Units with Solution-Based Benchmarks

Meanwhile, as the timing of this talk overlaps with some of our upcoming NAS reviews, we decided to open up the presentation to our readers as well in order to give all of you a look at some of what goes on behind the scenes here at AnandTech. We don't often get the opportunity (or time) to write much about our benchmarking selection process, so for us this is a chance to discuss a bit more about how we put together our tests. In addition to serving as a reference for the testing methodology in our reviews, we wanted to present the rationale behind our benchmarking routines and give you guys a chance to offer some feedback in the process.
Introduction and Evaluation Metrics
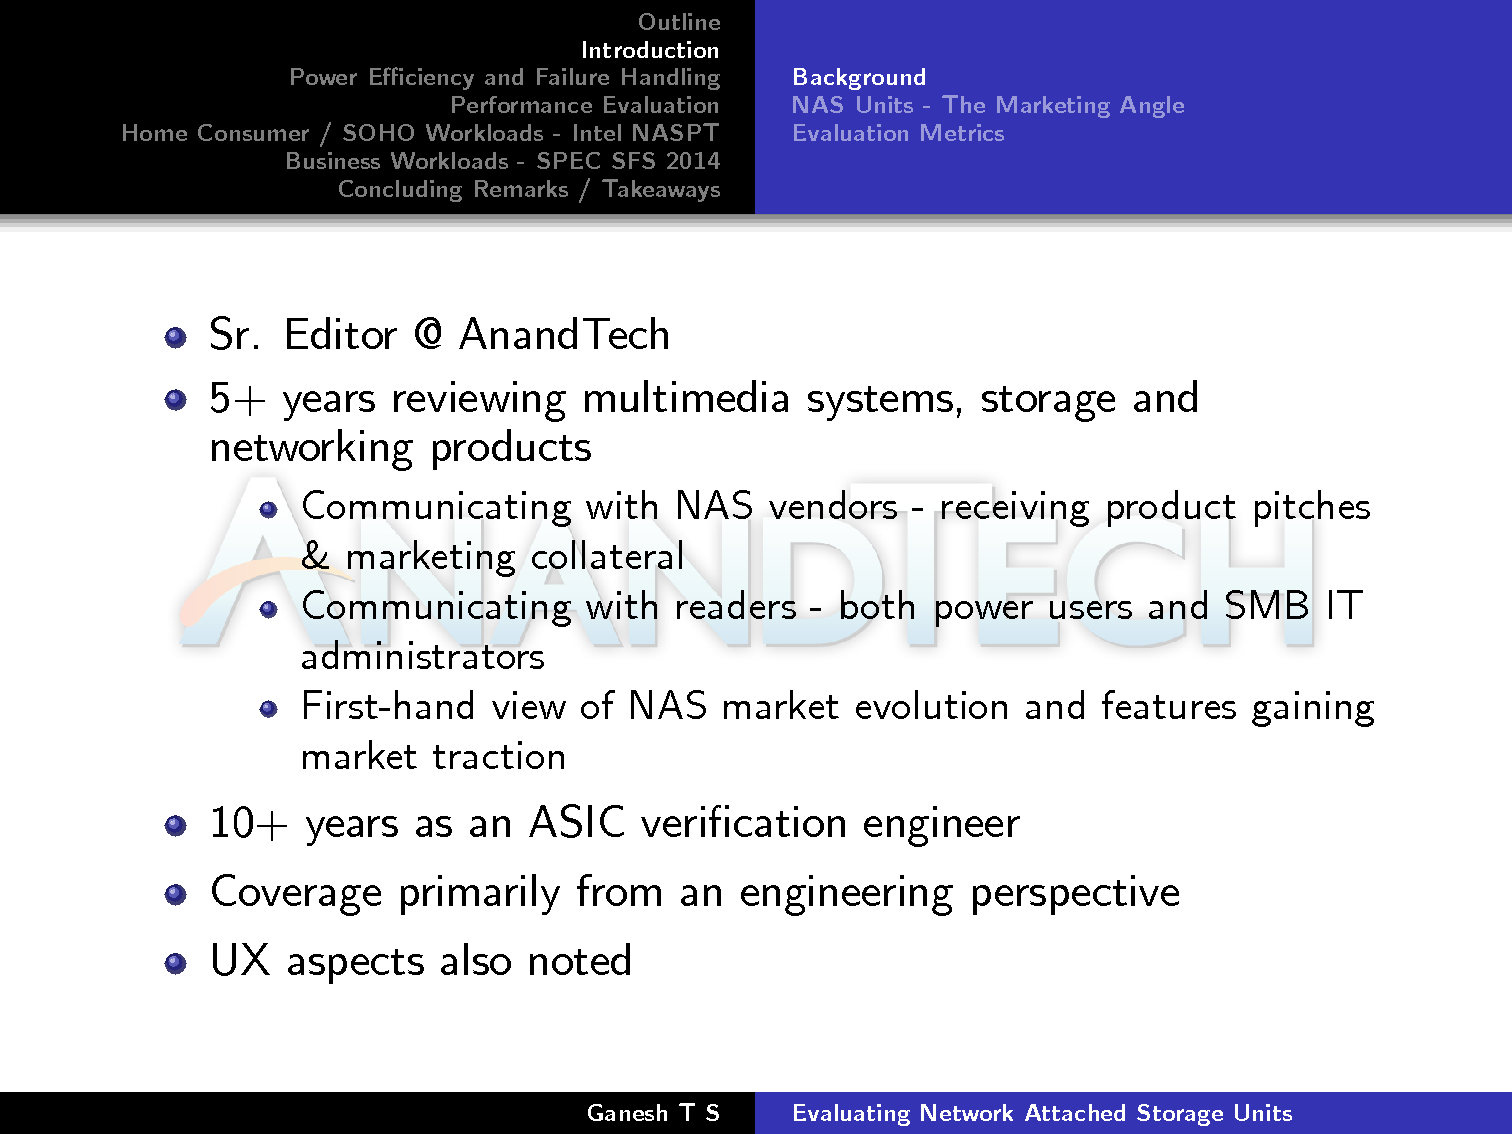
The presentation started off with a little
bit of background information about myself as well as our experience
with covering NAS units. We then moved on to a brief discussion of the
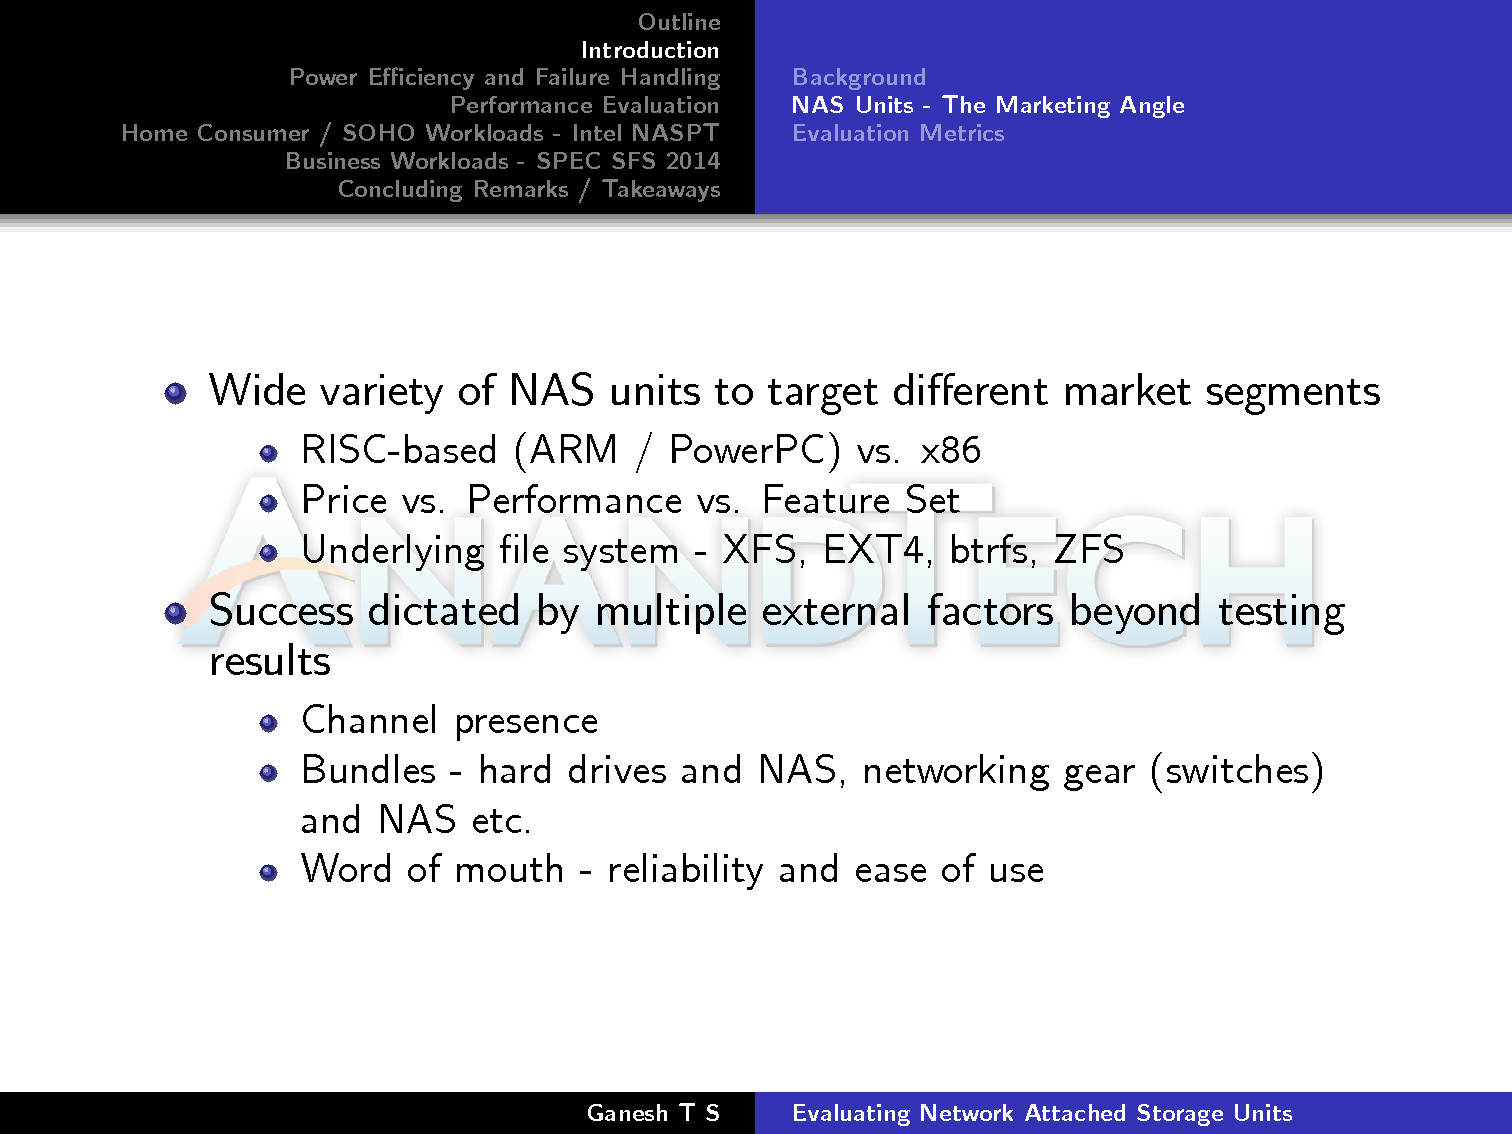
marketing aspects associated with any NAS unit. An important aspect from
a review perspective is that there are multiple units in the market
targeting different market segments, and it is not always possible to do
apples-to-apples comparison. In addition, a NAS unit receiving stellar
reviews from the press doesn't necessarily get automatic market success.
We believe success is often dictated by channel presence and bundling
deals (particularly in the SMB market).
Evaluation metrics can fall under two
categories - subjective and objective. The former refers to aspects such
as the management web UI. For example, Synology adopts a desktop-like
UI, while QNAP and Asustor adopt a mobile OS-like model. Netgear and
Western Digital, on the other hand, have a widget-based approach with a
rolling icon menu at the top. Different users have different
preferences, and it is difficult for a reviewer to point out any
particular interface as being the better one without bringing personal
opinion into the picture. Another aspect is the mobile app strategy.
While vendors like QNAP and Synology have multiple mobile apps for
different NAS functionalities (like multimedia streaming, management
etc.), ones like Western Digital have a single unified app for all the
user requirements. Again, different users might have different
preferences in this area. Finally, we have various value-added services.
Again, the user-experience with these features is difficult to cover
objectively (other than pointing out any obvious bugs in them). In any
case, these value-added services are fast becoming marketing checklists.
Users interested in any particular service would do well to research
that aspect thoroughly (by, say, going over forum posts dealing with the
aspect) rather than rely on press reviews. In most cases, these
capabilities get feature updates and bug fixes more often compared to
the core firmware.
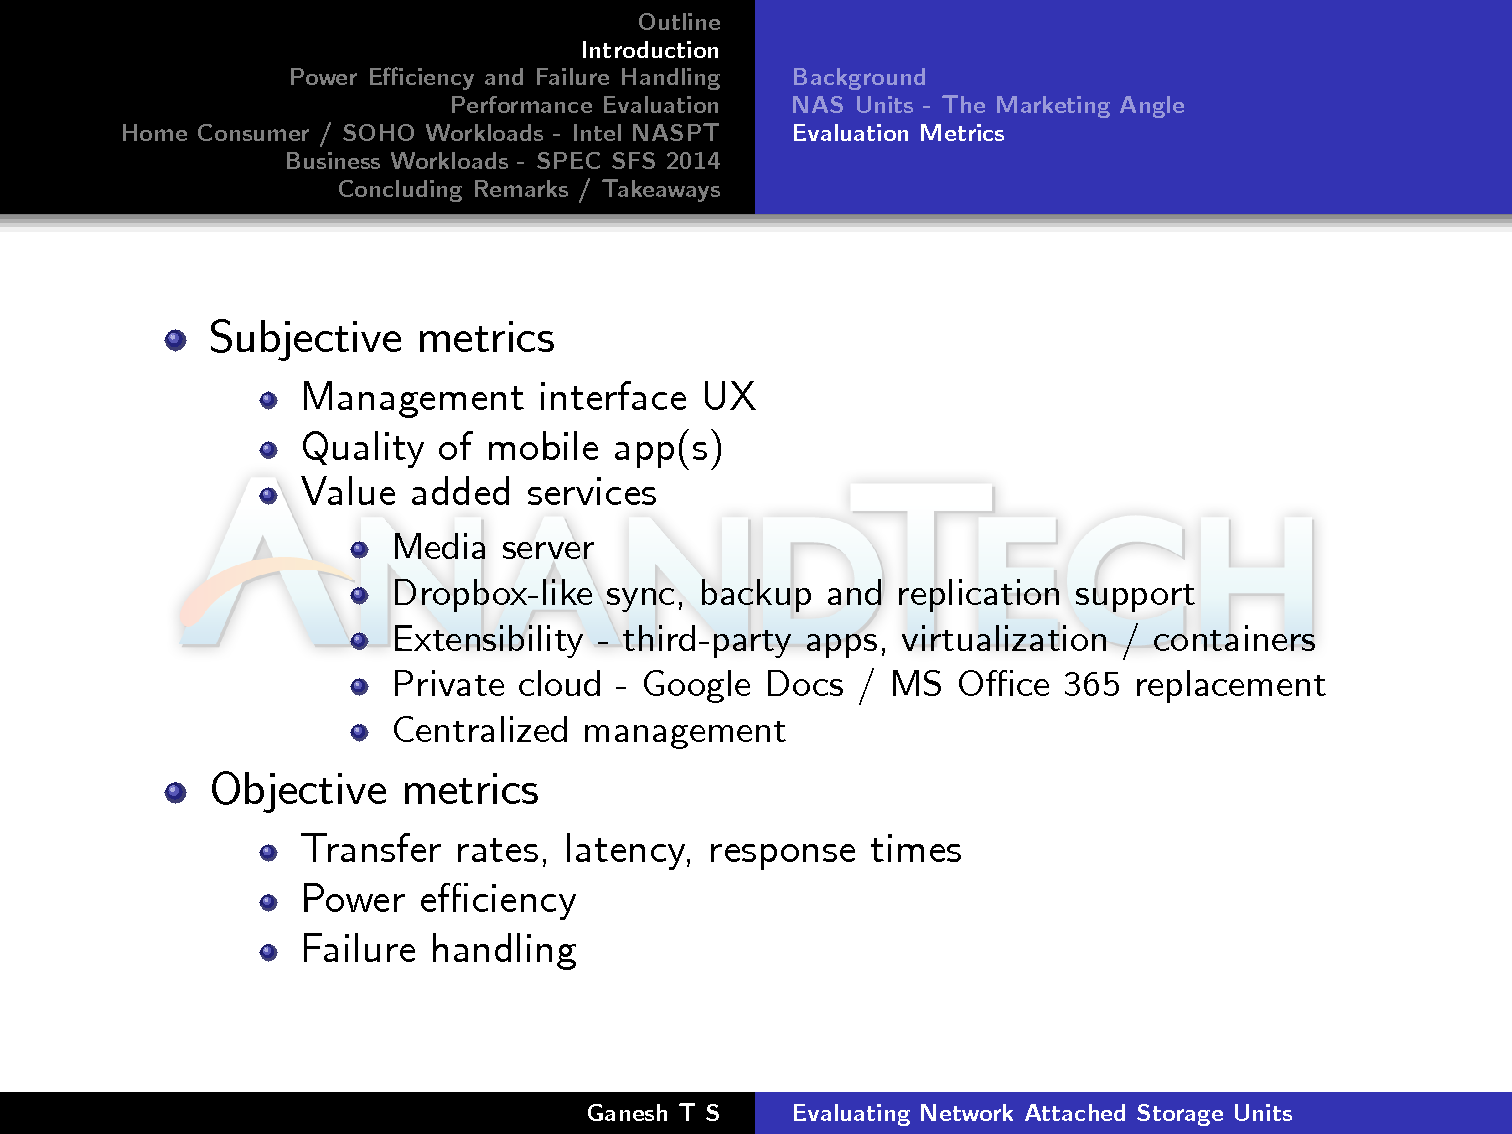
On the other hand, objective metrics such
as throughput and latency as well as power consumption numbers are more
straightforward to analyze. However, reviewers need to keep certain
aspects in mind, and we covered those later on in the talk.
Power Efficiency and Failure Handling
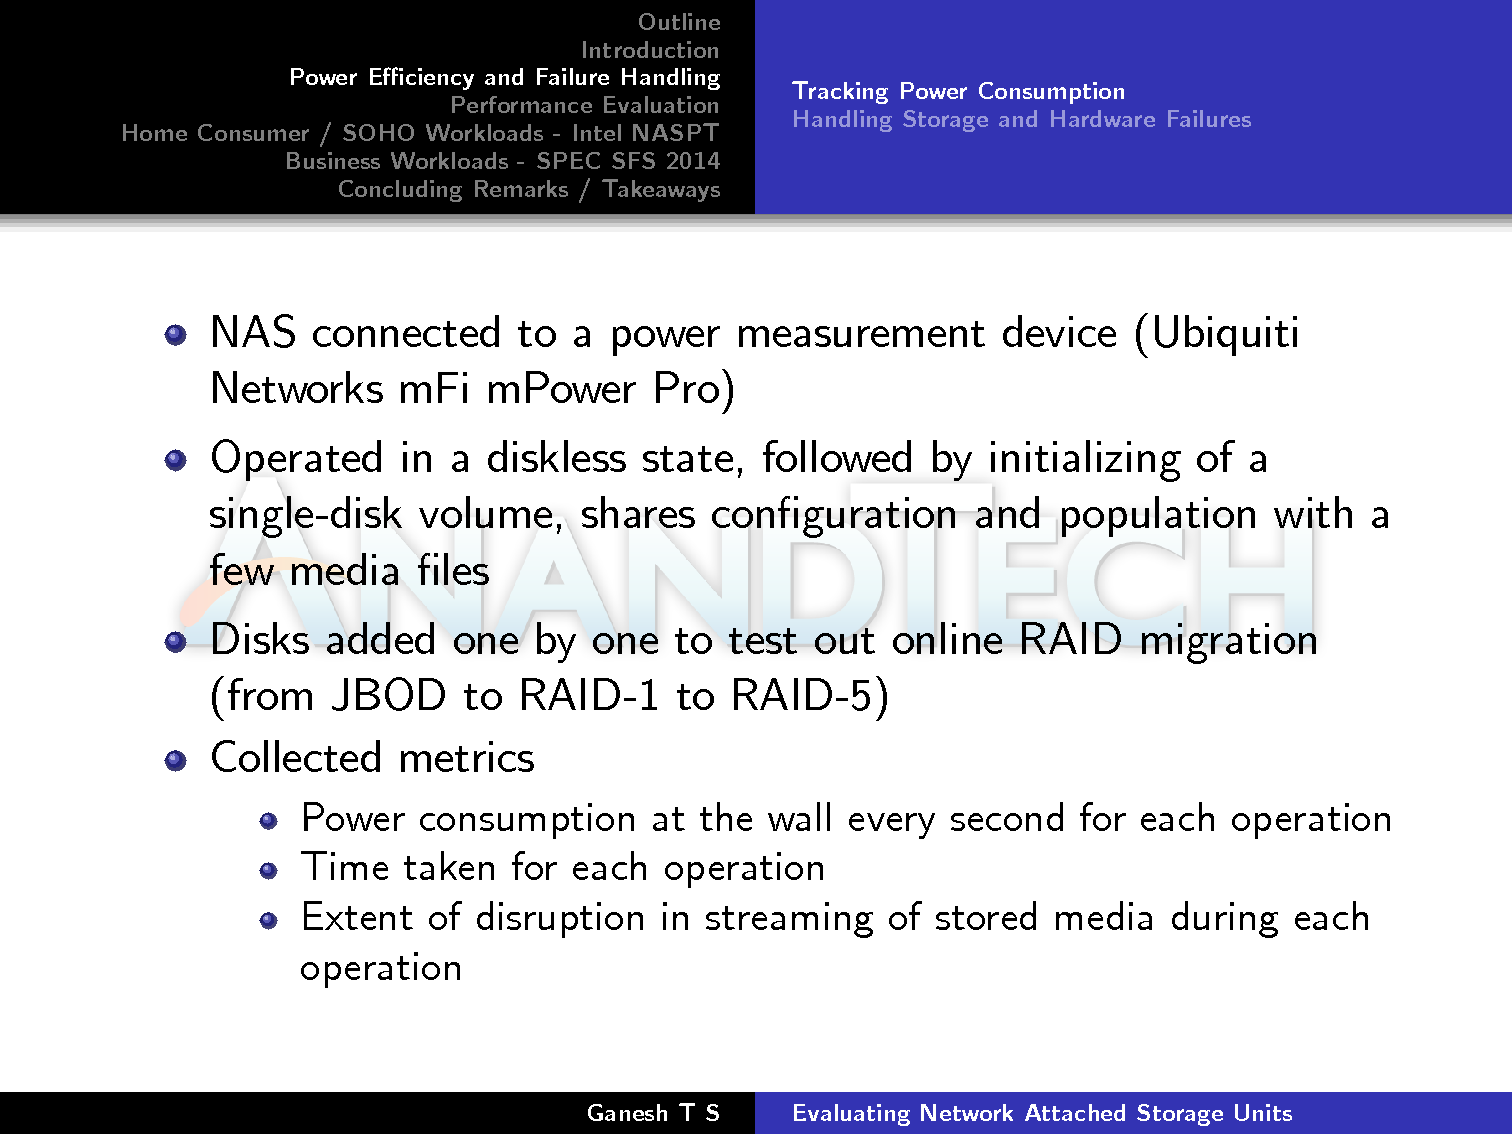
Readers of our NAS reviews already know
about our detailed power consumption and RAID migration / rebuild
testing. We presented a step-by-step account in order to shed further
light on our evaluation procedure.
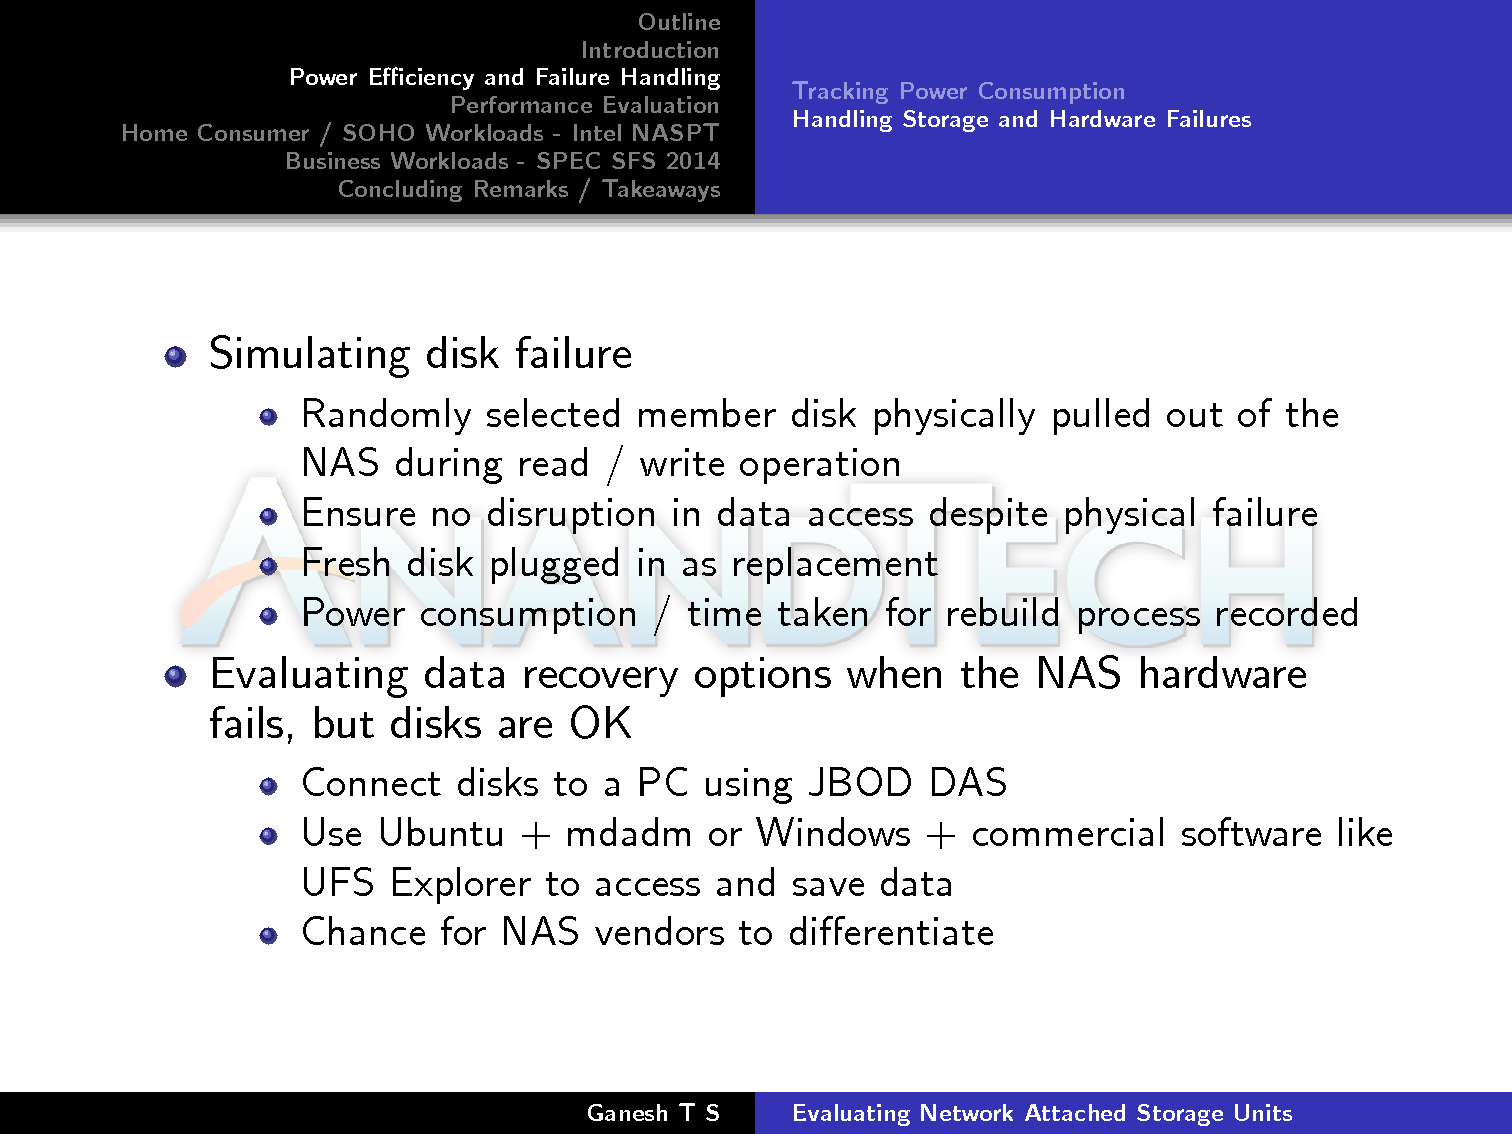
In terms of failure handling, we believe
NAS vendors can differentiate by providing Windows-based tools for
recovering data from arrays created on their NAS units. The current
easy-to-use options such as UFS Explorer are not free, and a free tool
from the NAS vendor would be great for consumers when the NAS suffers a
hardware failure, but the disks are in good condition.
Performance Evaluation
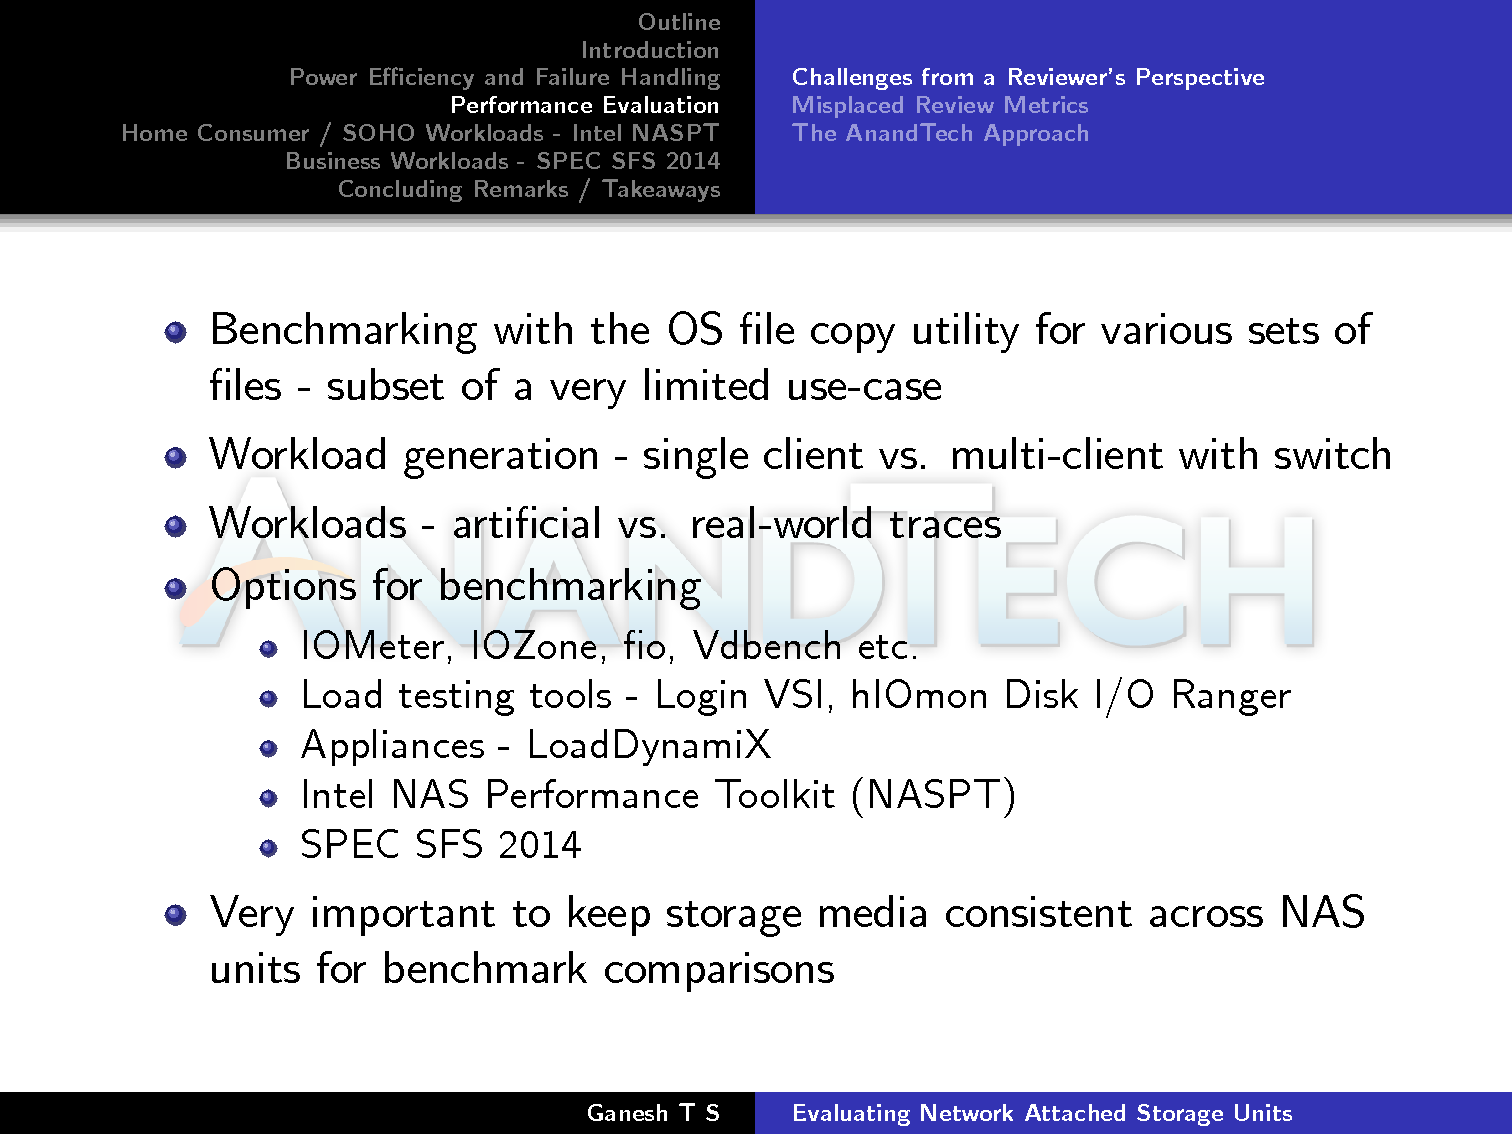
Many reviewers adopt file copy tests as a
measure of performance, but that doesn't serve to test out multi-client
performance or use-cases such as office productivity. There are number
of options available for benchmarking, but most of the open source ones
utilize artificial workloads. Even we have been guilty of using
benchmarks such as IOMeter and IOZone and presenting results from
running artificial workloads on various NAS units. On the other hand, we
have commercial load testing tools such as Login VSI (for testing
virtualization loads) and hIOmon for replaying and analyzing performance
with actual system traces. LoadDynamiX is an appliance that can be used
to stress storage nodes, but, again, it is easier to run artificial
workload traces (with additional metadata access) on them rather than
real-life traces.
The Intel NAS Performance Toolkit (NASPT)
is undoubtedly the most popular benchmarking tool amongst reviewers
handling NAS units. However, it is prone to misuse. I have often seen
transfer rates obtained using different disks on different NAS units
used as comparison points. It is essential that the storage media as
well as the client used to run the tests be the same across all NASPT
evaluations. We covered NASPT in detail later on in the presentation.
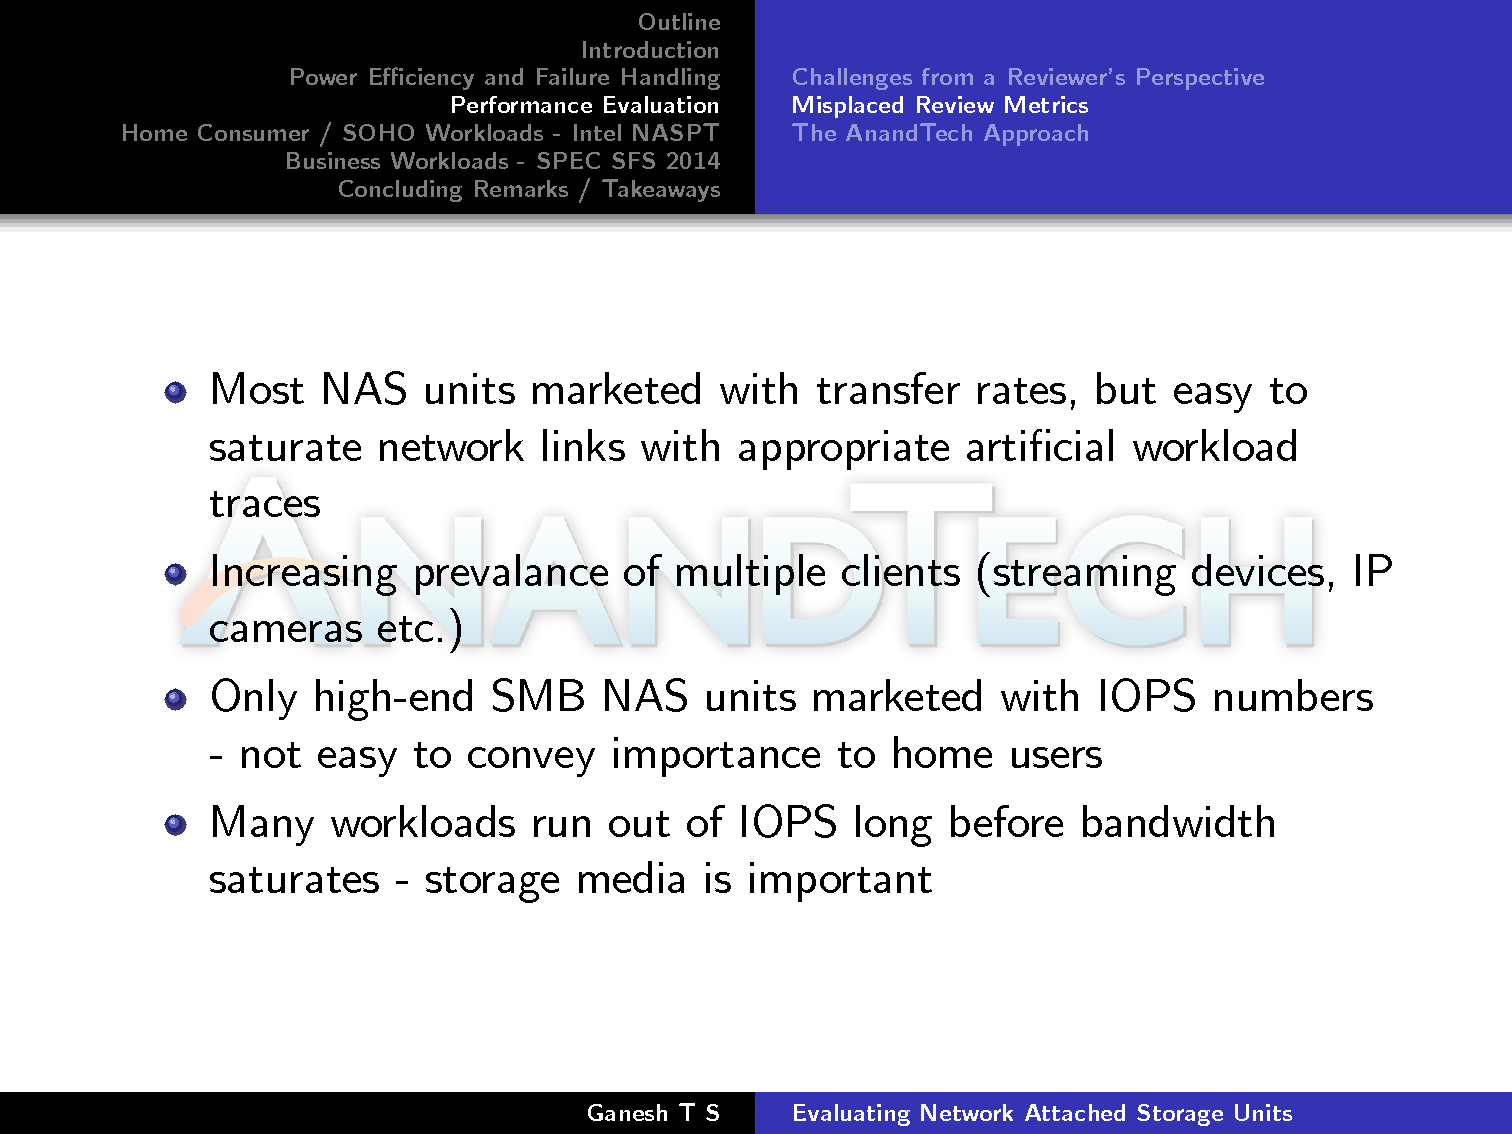
Moving on to the marketing aspects
associated with performance, we find that many vendors just provide read
and write transfer rates for a pre-specified configuration.
Unfortunately, there is no consistency across vendors and in any case,
this metric is easy to manipulate in order to mislead consumers. With
increasing prevalence of multiple clients of different types, these
transfer rates are almost never going to be experienced by the average
end-user. The metric that actually matters for stressful workloads (most
business use-cases) is IOPS. However, it is not easy to convey the
importance of IOPS to home users, as they have no idea of what the
requirements for their workload are going to be. It is a situation that
reviewers could do well to address.
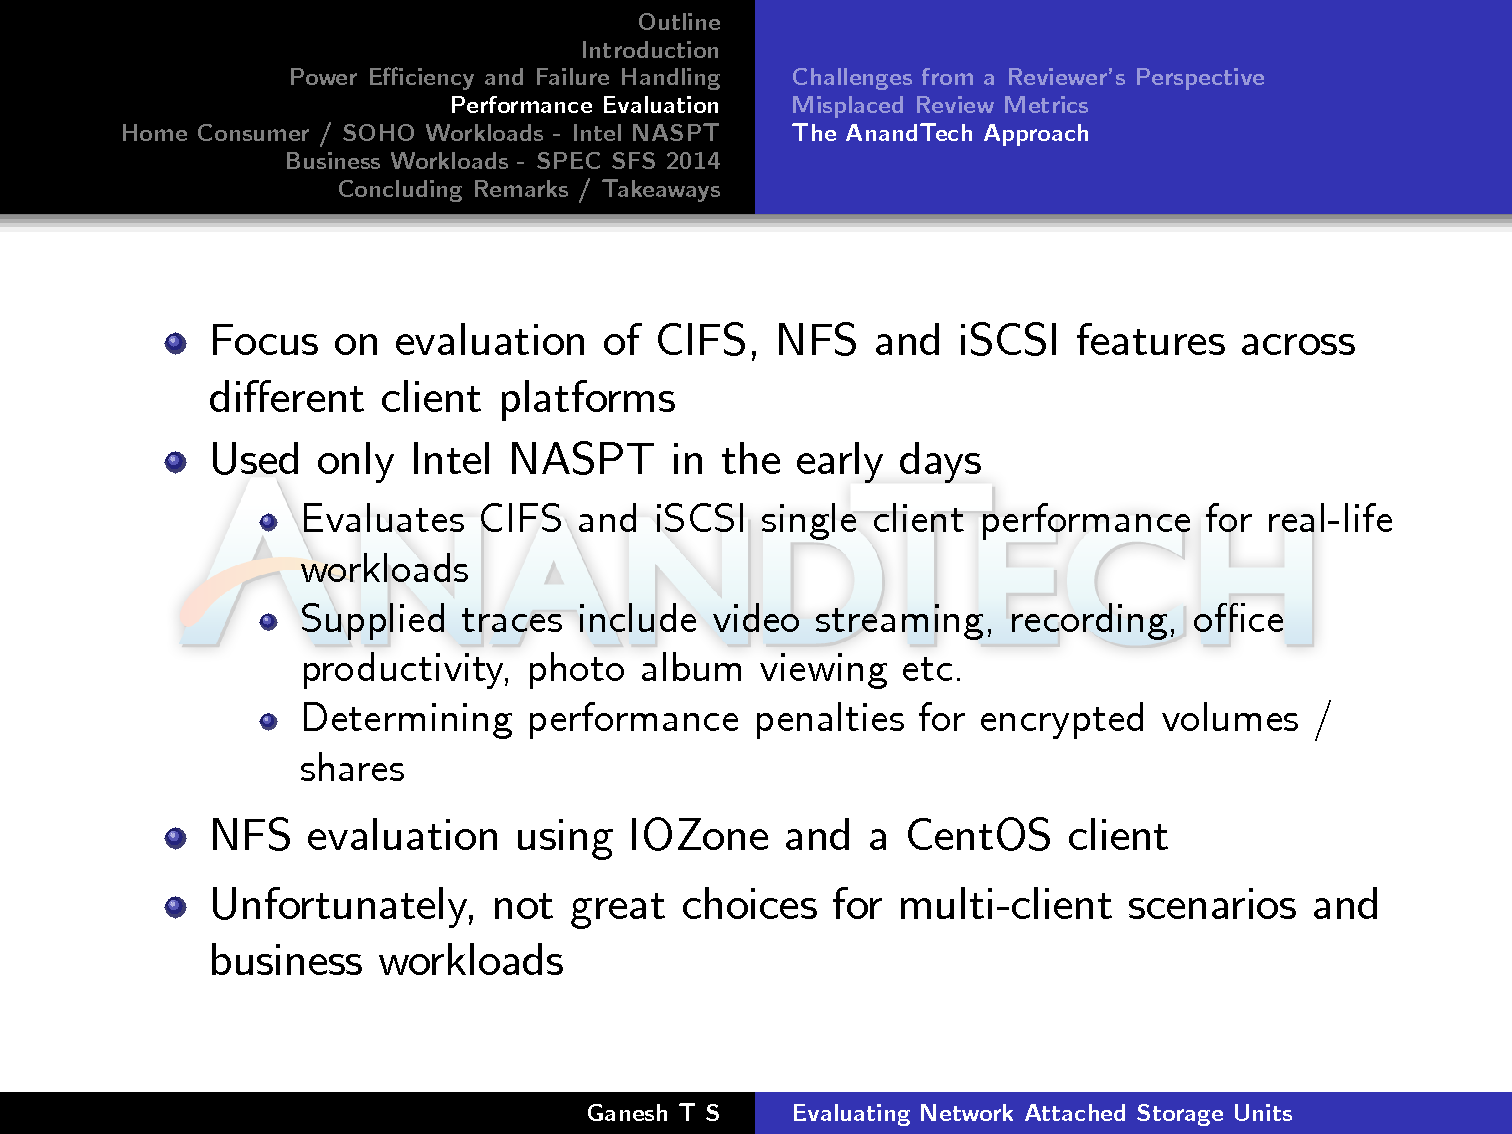
At AnandTech, we focus on three main
services - CIFS, NFS and iSCSI - across both Windows 7 and Linux (CentOS
/ Ubuntu). We used to rely on Intel NASPT in the early days for CIFS
and iSCSI. Linux / NFS utilized IOZone. Unfortunately, they are not
great choices for multi-client testing.
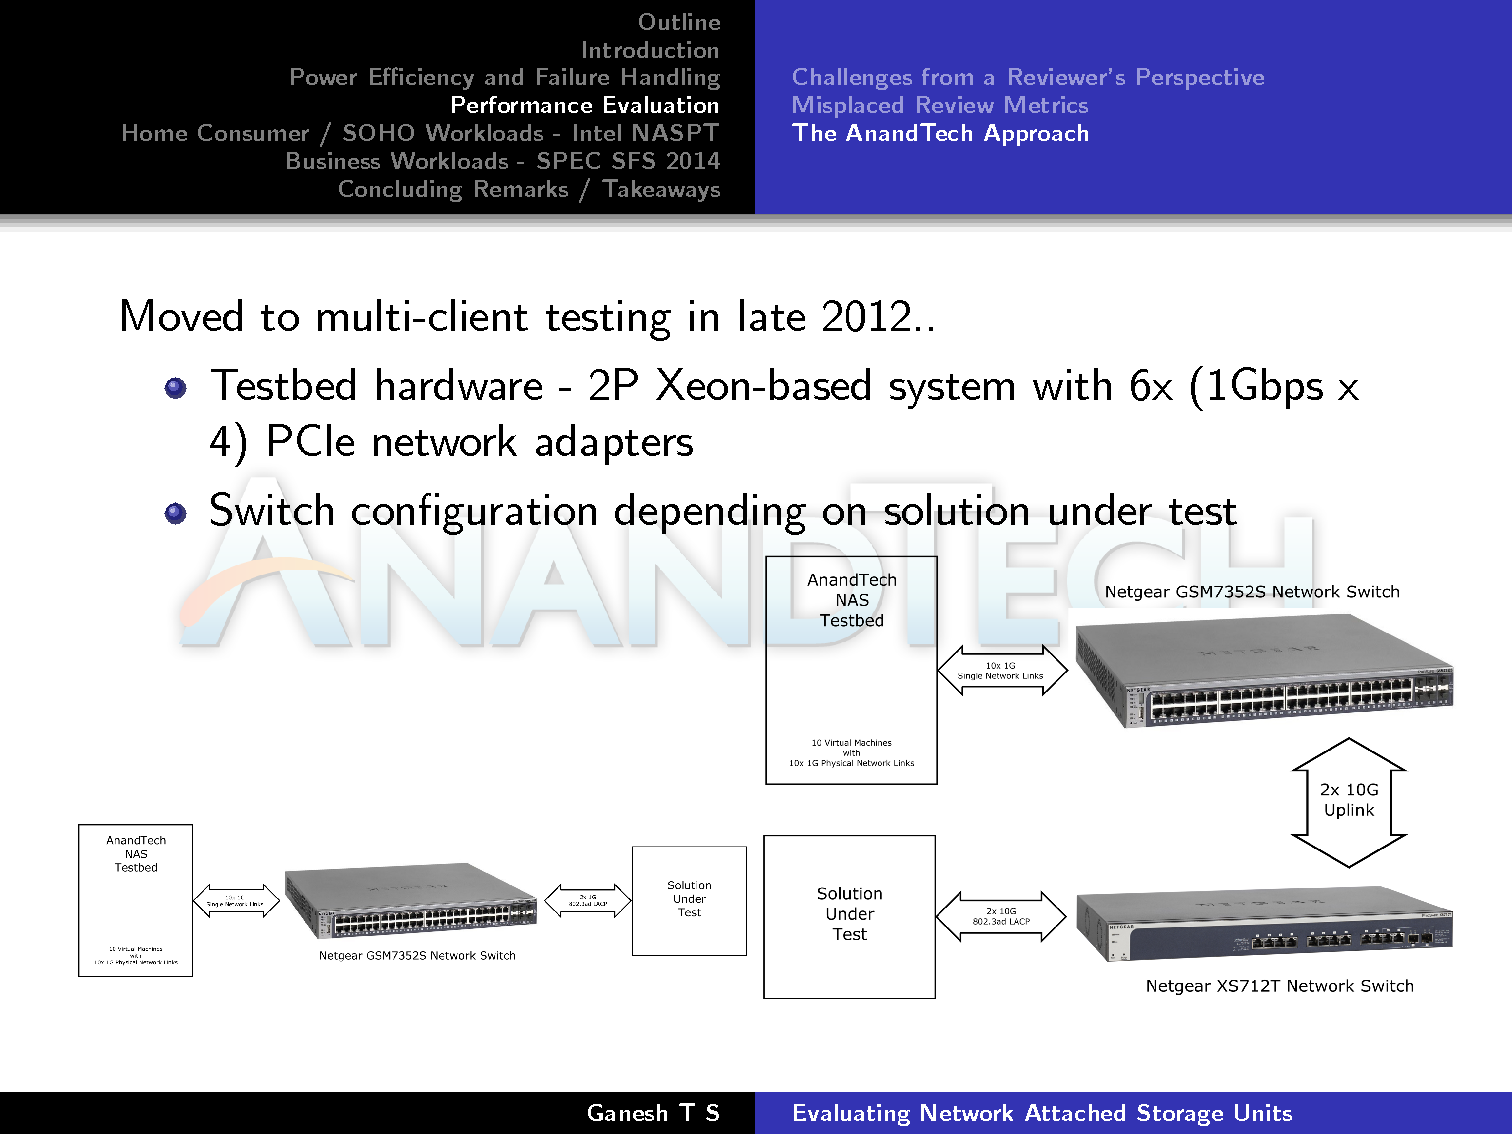
We decided to focus on multi-client testing
a few years back and set up configurations similar to the ones depicted
in the slide below. The number of VMs that could be simultaneously
active on the NAS testbed could be up to 25.
Our workload / benchmark program of choice
was four artificial traces with IOMeter. We chose IOMeter partly because
of the in-built synchronization across multiple clients. Unfortunately,
all our graphs presented bandwidth numbers and latencies that were
difficult for the average end-user to relate to.
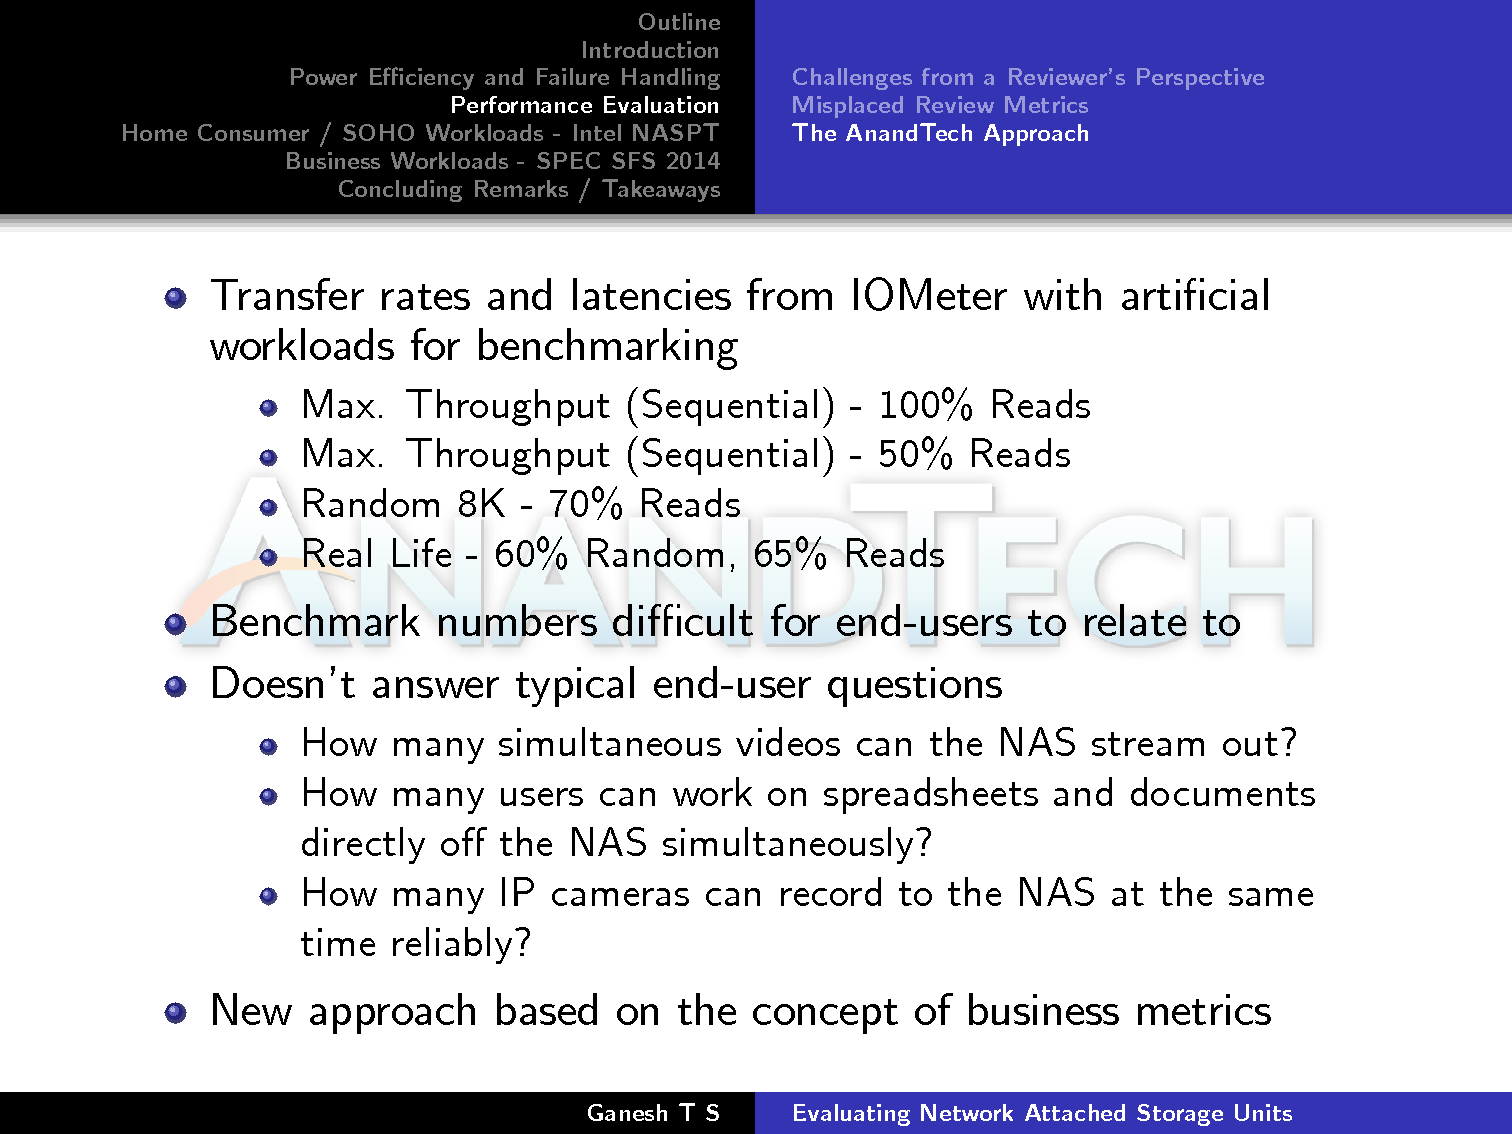
The typical NAS user wants a review to
provide clear-cut answers for questions such as: "How many simultaneous
videos can the NAS stream out?", "How many IP cameras can be reliably
recorded on the NAS at the same time?". In our opinion, these
'solution-based metrics' are the holy grail of any NAS evaluation, and
that dictated the approach we have been adopting in our recent NAS
reviews.
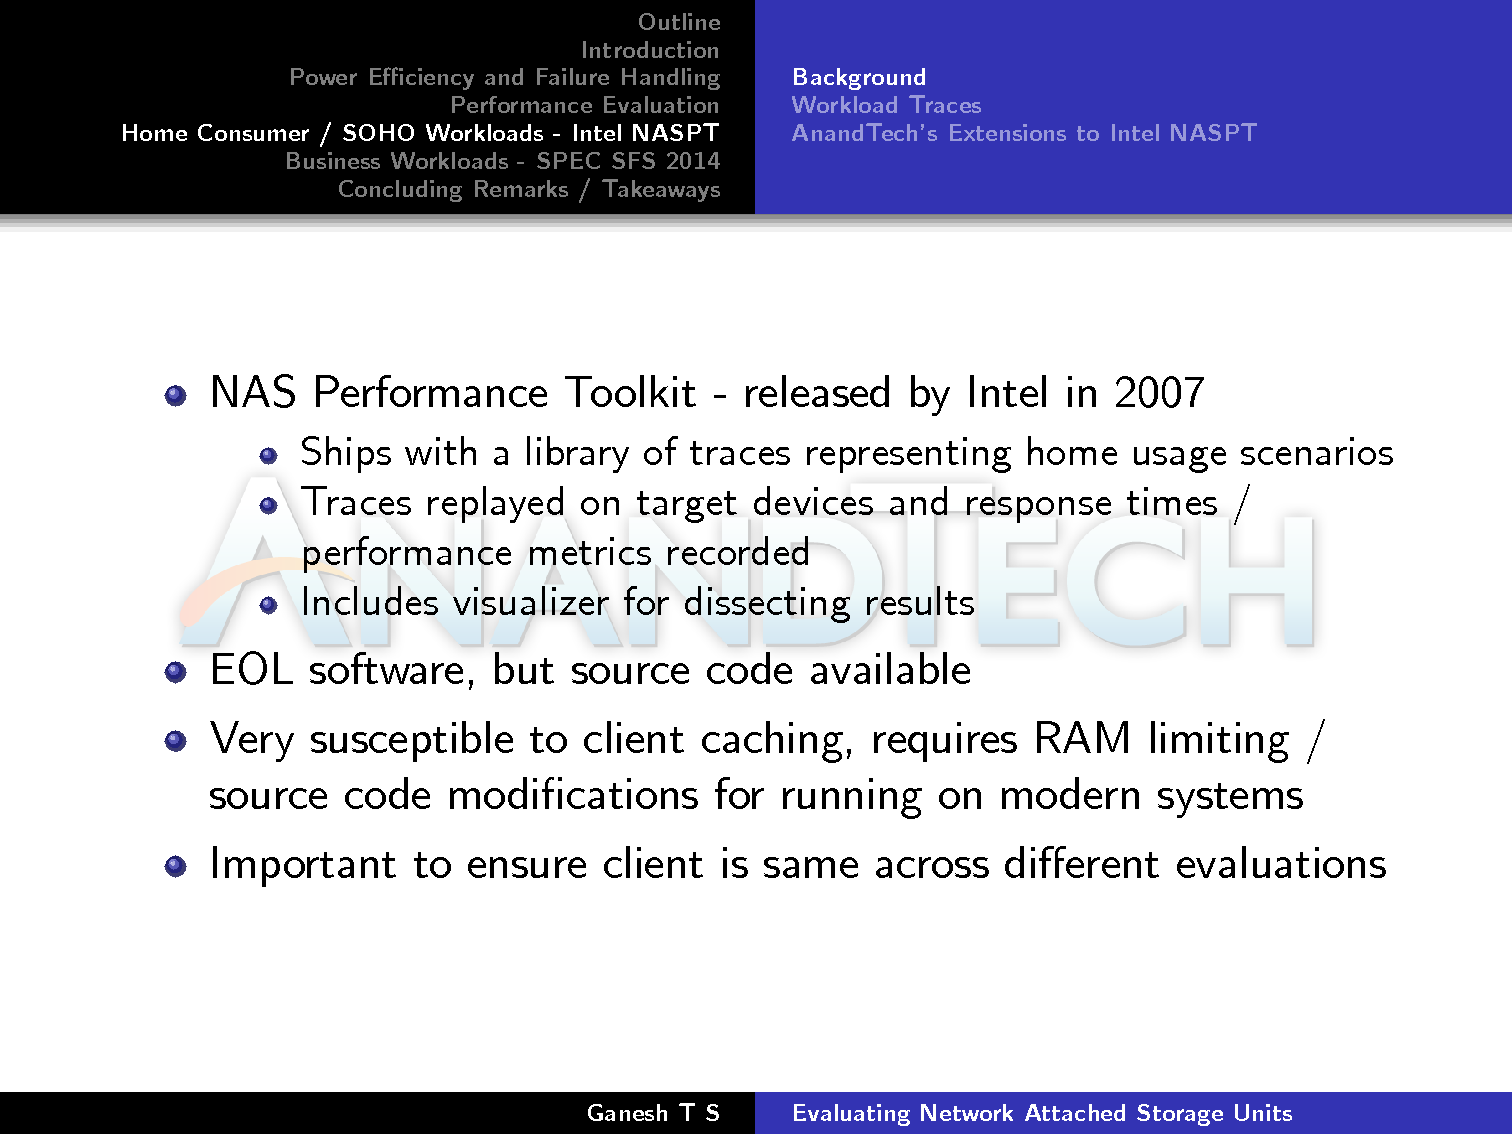
Intel NASPT and AnandTech's Extensions
Intel NASPT was first released at IDF in
2007. It adopted a real-world workload trace replay approach. In those
days, NAS units struggled to provide USB 2.0 speeds despite being
equipped with GbE LAN ports. For extensive workload behavior analysis,
NASPT also shipped with a visualizer. NAS units have improved by leaps
and bounds since then, and saturating network links is now hardly
difficult for most NAS units. Despite being actively used by reviewers,
Intel dropped support for NASPT as it had served its original purpose -
targeting improvements in NAS units meant for home and SOHO (small
office, home office) use. Fortunately, Intel decided to release the
source code and this allowed us to build custom versions that could be
used on modern systems.
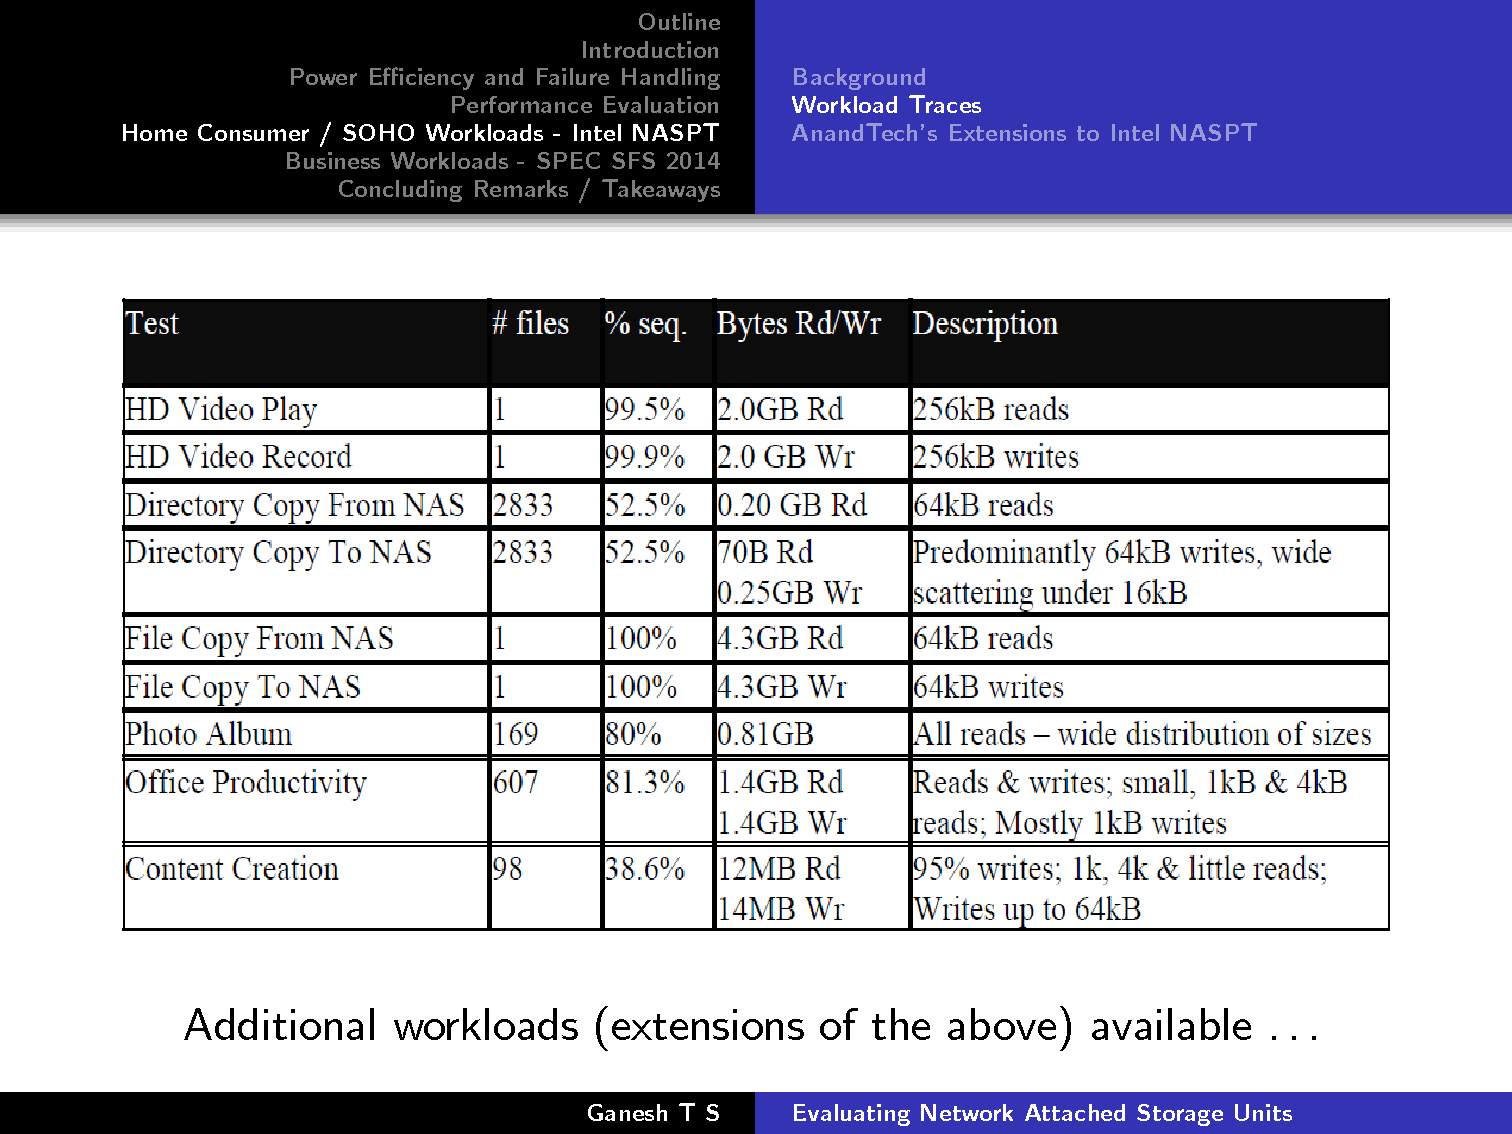
NASPT utilizes traces that were recorded on
real systems during actual operation. A summary of the various aspects
of each trace is provided below.
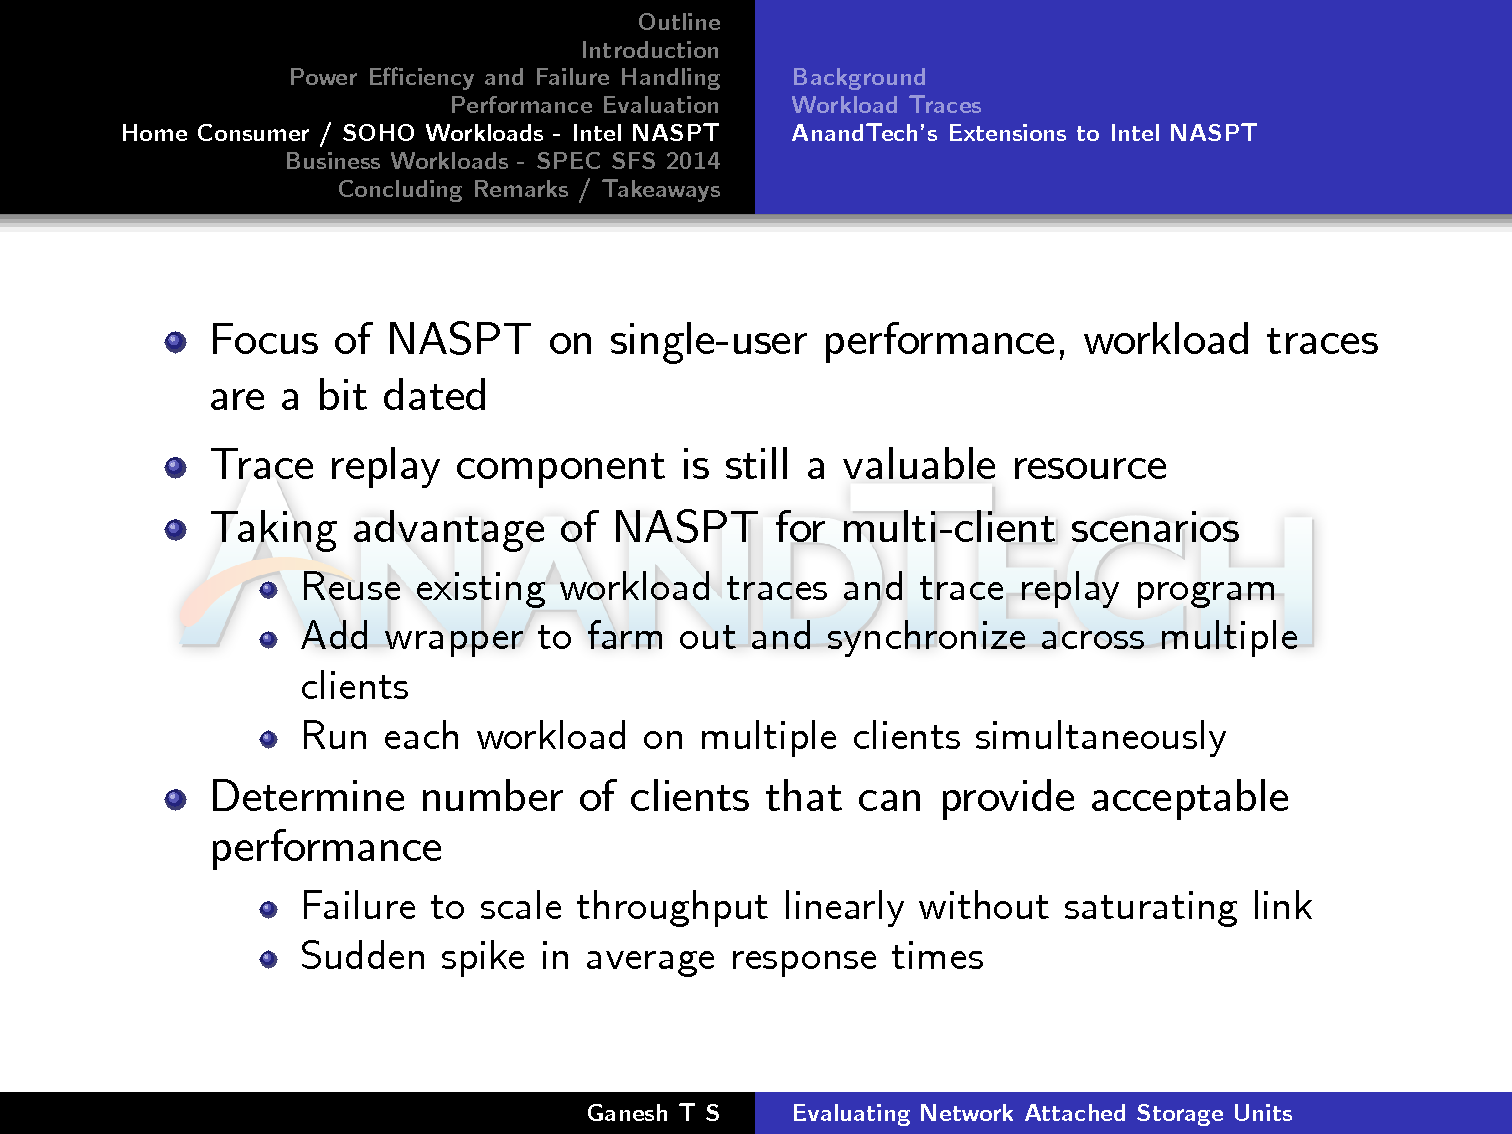
How could Intel NASPT be used to address
our eventual goal of the determination of solution-based metrics? We
know that the workload traces, despite being a bit dated, are from
real-world applications. The internal trace replay component is still a
valid tool. We took advantage of these two portions of NASPT and added a
wrapper to farm out the trace replay to multiple clients and also
synchronize their execution. Determination of the 'solution-based
metric' then boiled down to the number of clients that could provide
acceptable performance.
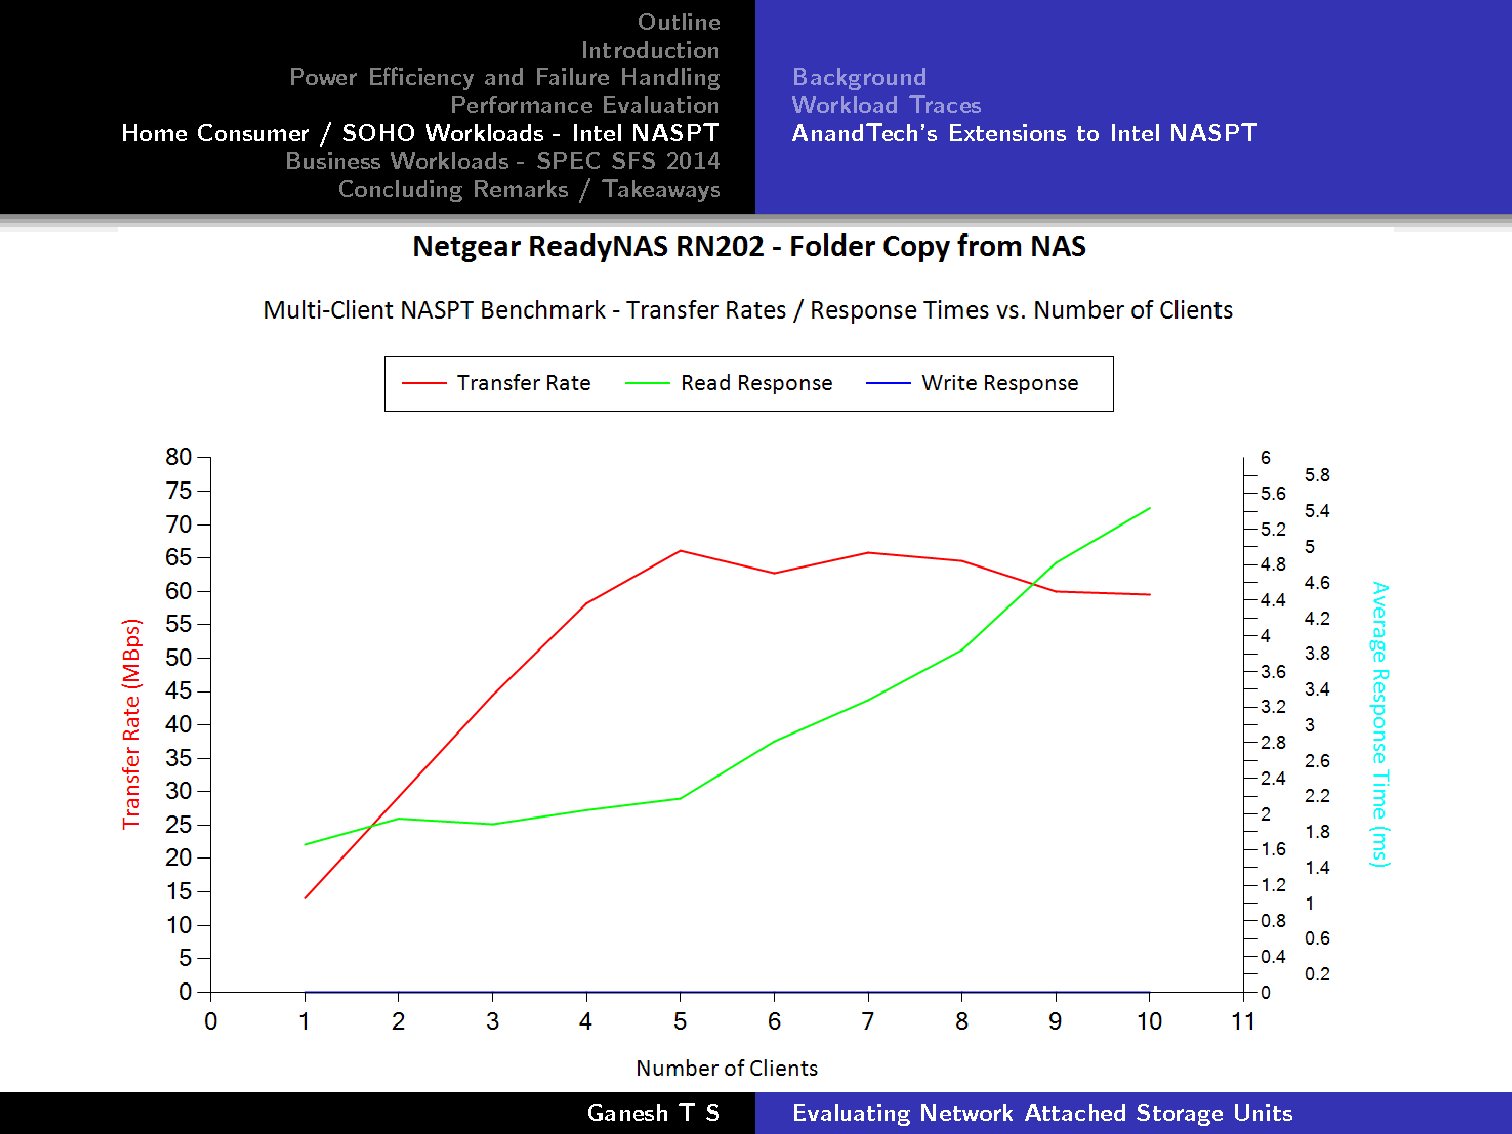
We cited an example from our recent review
of the Netgear ReadyNAS RN202. In the 'Folder Copy from NAS' workload,
we found that the transfer rate saturated beyond 5 clients around 560
Mbps (despite the theoretical link-aggregated bandwidth being 2 Gbps).
The average response time also starts to show a steep slope after 5
clients. We could interpret the graph as suggesting that the system
(RN202 + 2x WD4000FYYZ drives) could support up to 5 clients performing
folder copies to the NAS simultaneously.
SPEC SFS 2014
Our experiments with the concept of
business metrics and solution-based benchmarking was actually triggered
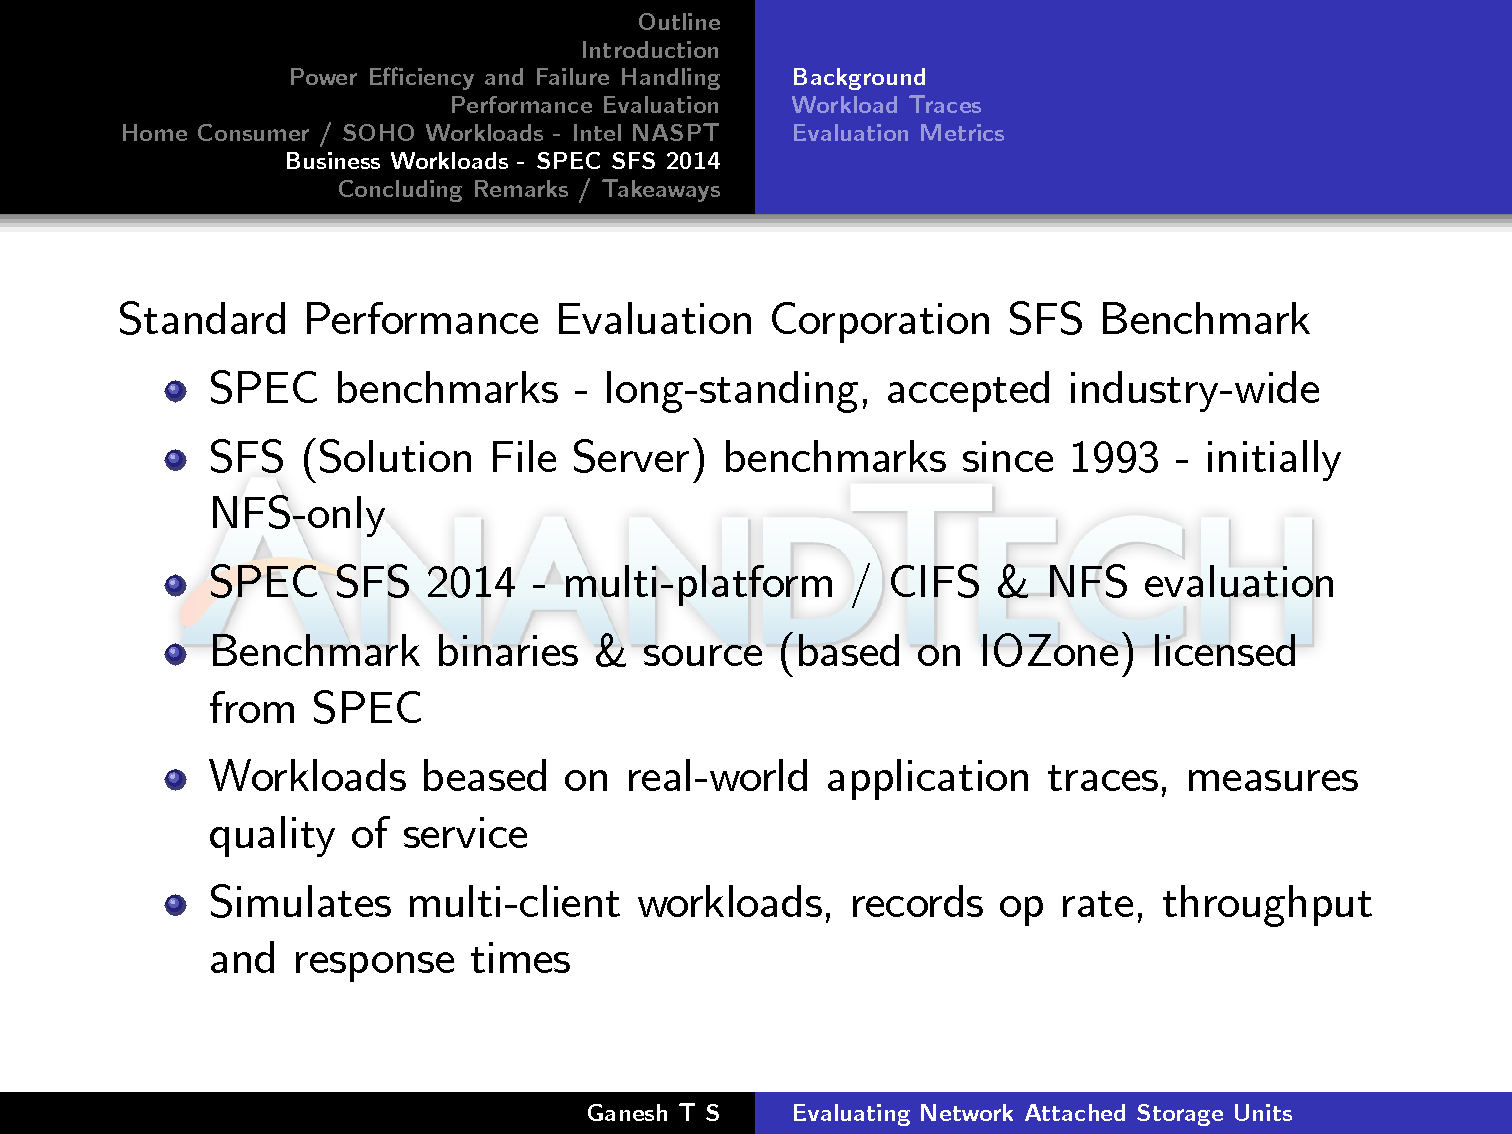
by the SPEC SFS 2014 benchmark. SPEC's SFS benchmarks have been around
since 1993. The latest release (SPEC SFS 2014) can benchmark both CIFS
and NFS shares. The benchmark is based quite a bit on IOZone and the
workload traces that are run by the benchmark have been collected on
live systems by various vendors participating in the benchmark. Unlike
Intel NASPT, the SPEC SFS 2014 benchmark has been designed from the
ground up to provide concrete answers for the solution-based metrics
that can be supported by a storage node. In order to aid in the decision
process, each benchmark run records various business metrics such as
the achieved operation rate, throughput and response times.
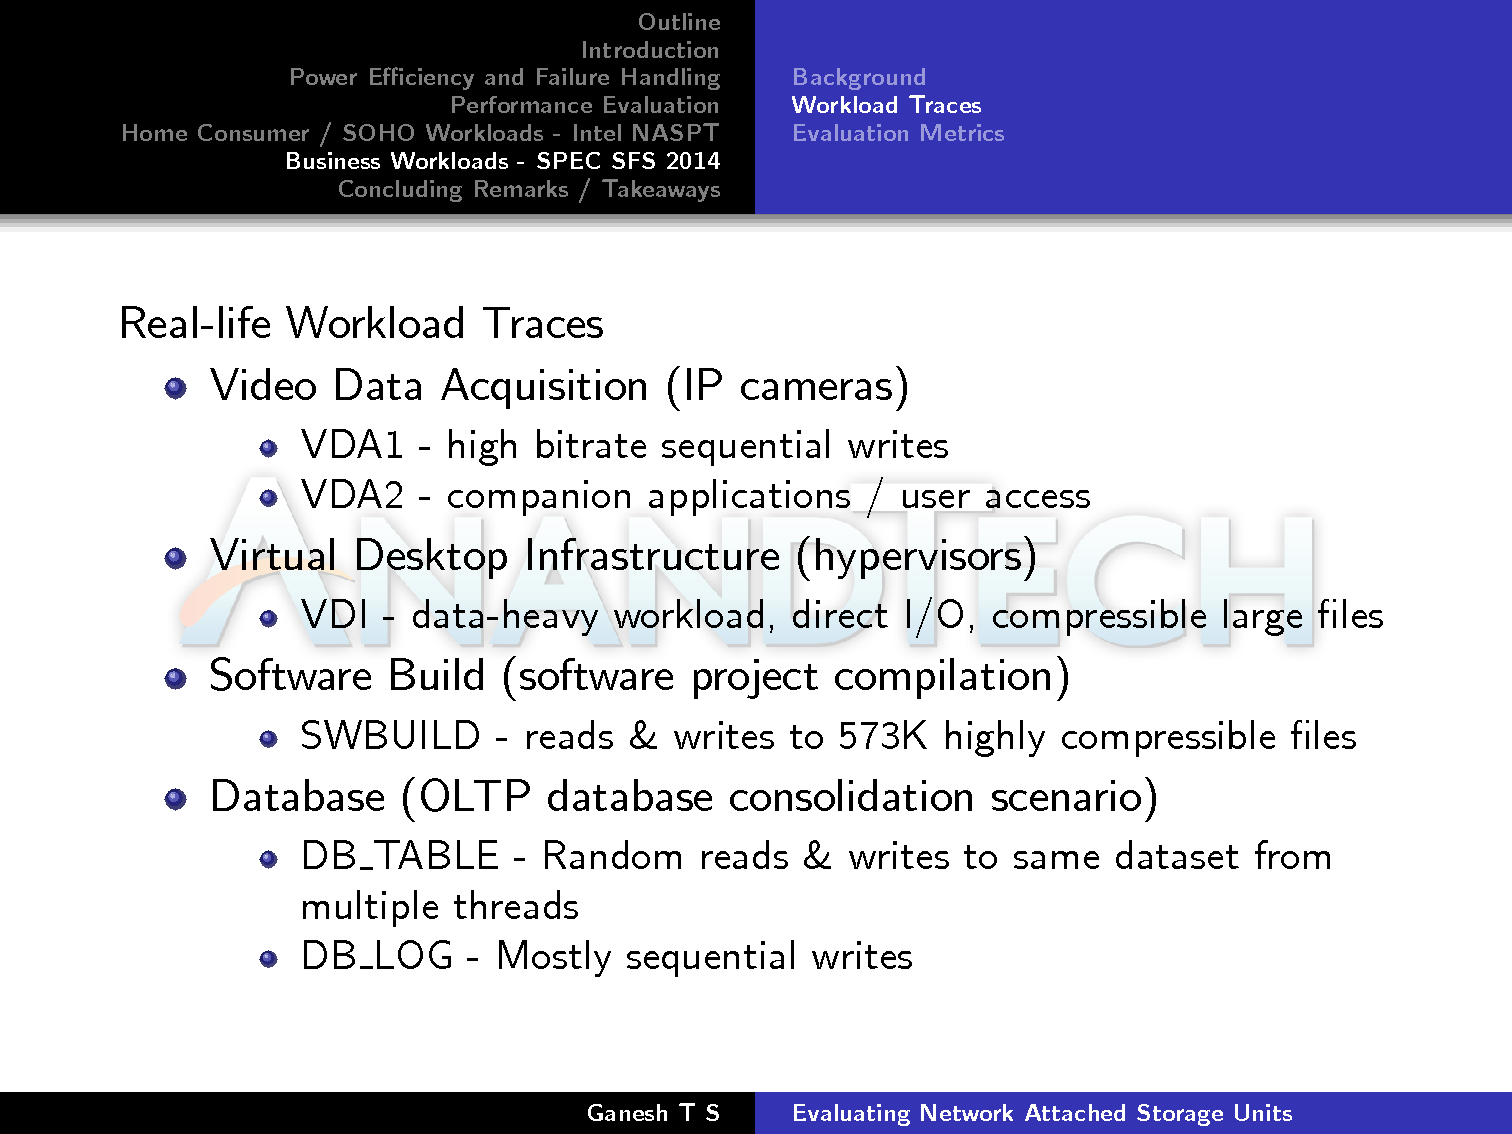
A summary of the various aspects of each
trace is provided below. The VDA workload includes contribution from IBM
while Microsoft and EMC contributed to the VDI one. NetApp provided the
SWBUILD workload, while the DB workload was created with contributions
from NetApp and Oracle.
SPEC SFS 2014 automatically parses the
results from each benchmark run and provides us with a single load point
(could be the maximum number of clients tested) and an associated
average latency as an indication of the quality of service. The success
criteria at each load point is based on the collected business metric at
that point as well as the requirements with respect to the oprate and
acceptable workload variance across the component processes.
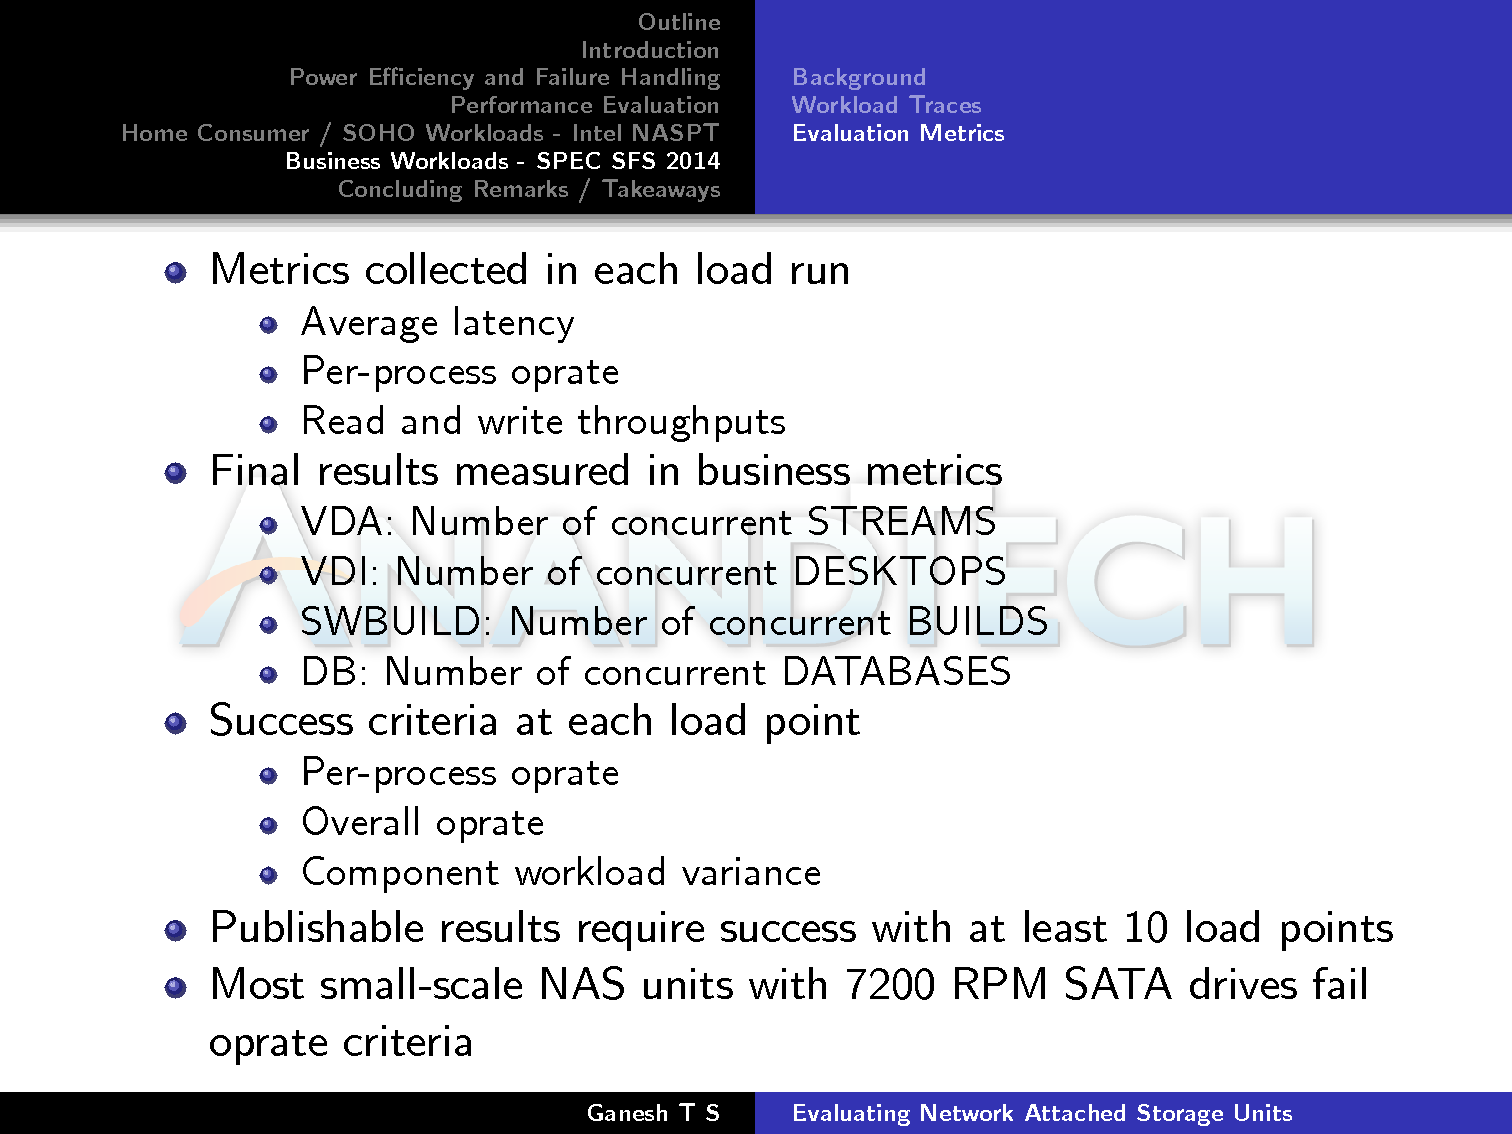
The SPEC SFS 2014 benchmark requires at
least 10 load points for a publishable result. It is designed for large
scale systems. Almost all 2-, 4- or 8-bay NAS units fitted with 7200 RPM
SATA drives fail this requirement. However, with SSDs, the results
should be much more interesting, as we will see in future reviews.
Future Work & Concluding Remarks
We took a break from reviewing NAS units
after publishing our Western Digital DL4100 in March 2015. In the mean
time, we were able to get our 'solution-based benchmarking' strategy to a
state fit enough to use for published reviews. However, we still have a
number of avenues left to explore. It would be nice to update the NASPT
traces with workloads corresponding to, say, 4K video playback or
backup jobs. Investigation into hypervisor effects would be an
interesting thing to do (as we use virtual machines with dedicated
network links for simulating clients). Many NAS vendors are supporting
SMB multi-channel now, and it would be prudent to move from Windows 7 to
Windows 10 as the guest OS for the VMs soon. The most important task,
however, is to formalize the determination of acceptable business
metrics for the NASPT workloads in a manner similar to what has been
done for the SPEC SFS 2014 workload traces.
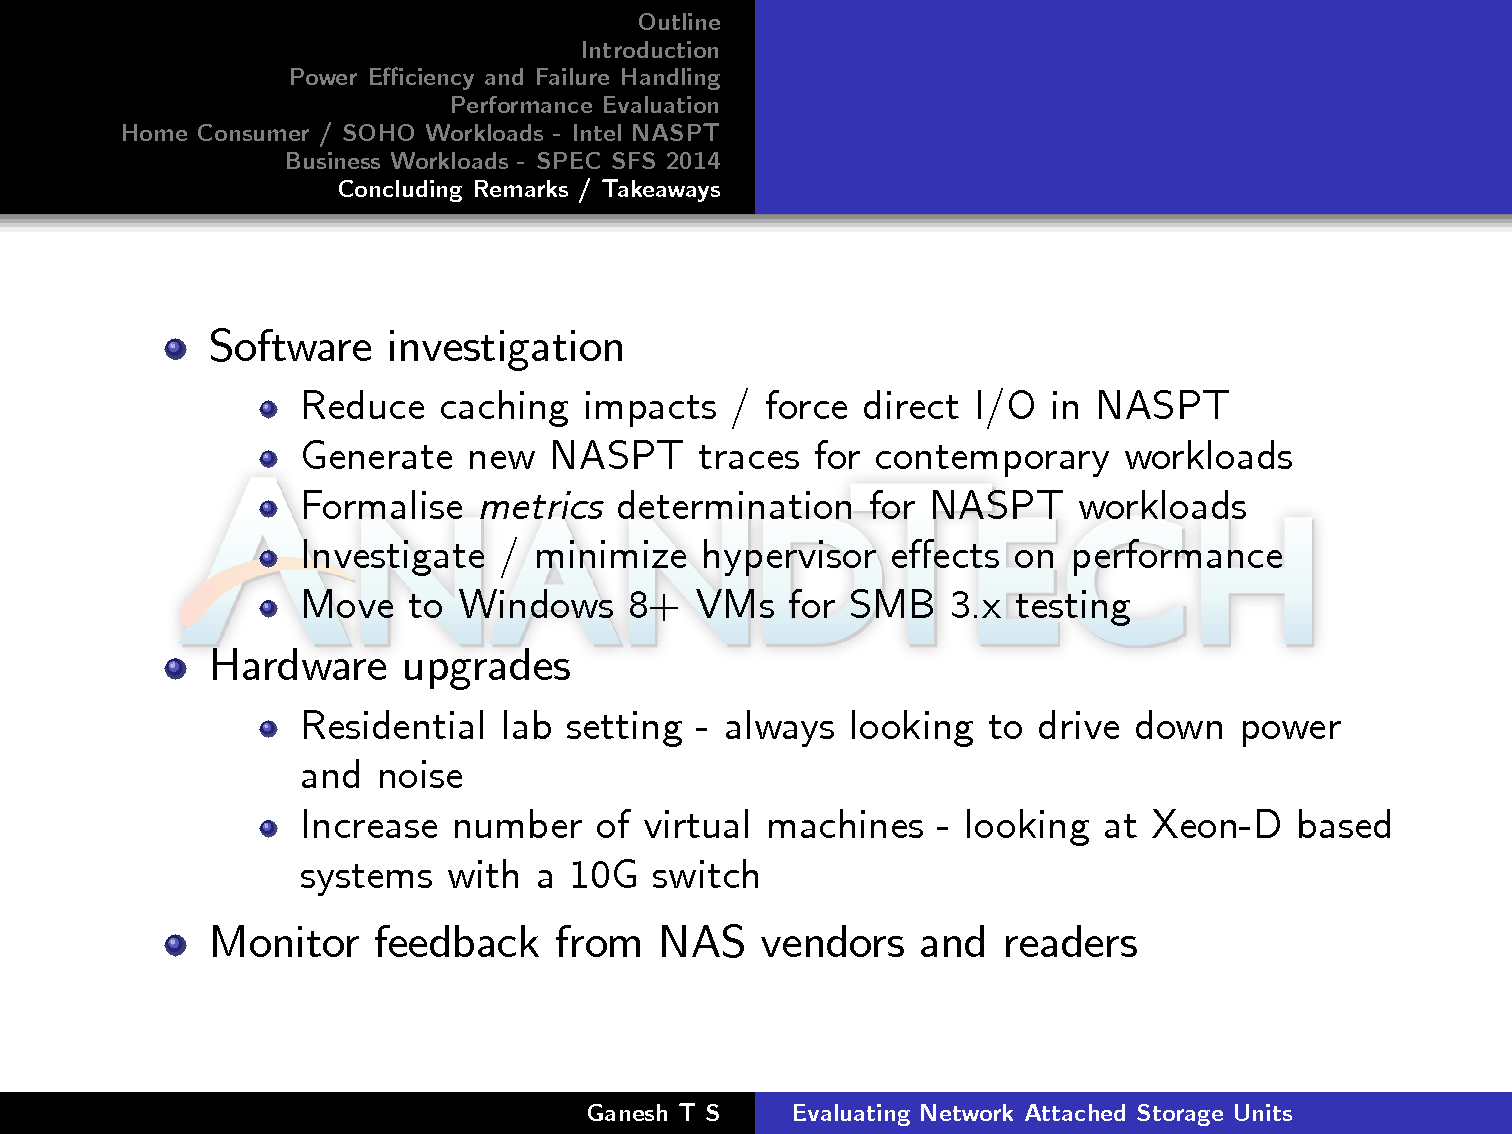
In terms of hardware upgrades, the current
testbed is being operated in a residential setting, and I am always
looking to drive down the power consumption and the noise. In
particular, the Netgear XS712T (12x 10GBASE-T smart switch) has a 50 dB+
official rating, and it would be nice to have a quieter alternative.
The other aspect is the NAS testbed itself. We are currently using a 2x
Intel Xeon E5-2630L system. However, Xeon-D systems with the integrated
10GBASE-T ports are looking very attractive right now in terms of
allowing us to operate more virtual machines within the same power
budget.
As always, we look forward to more feedback
on our strategy as well as additional suggestions from NAS vendors as
well as readers. A PDF copy of the full presentation is available in the
source link below.
Read More ...
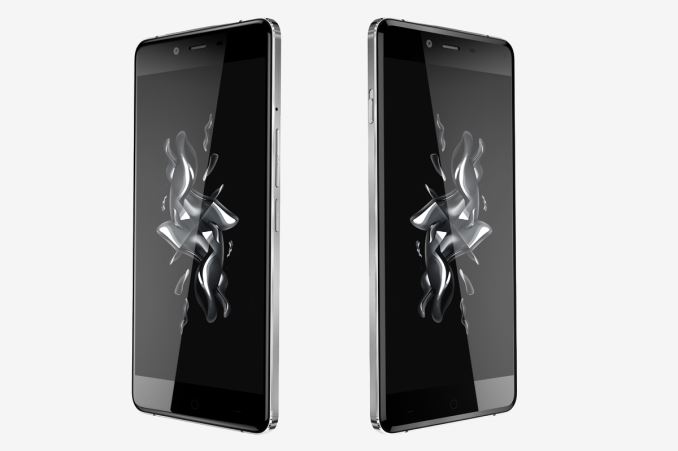
OnePlus Launches the OnePlus X

| OnePlus X | |
| SoC | 2.3GHz Qualcomm Snapdragon 801 (MSM8974AB) |
| GPU | Adreno 330 |
| RAM | 3GB LPDDR3 |
| NAND | 16GB + MicroSDXC (No MicroSD on dual-SIM) |
| Display | 5" 1920x1080 AMOLED |
| Dimensions | 140 x 69 x 6.9 mm, 138/160g |
| Camera | 13MP Rear-Facing, f/2.2 8MP Front-Facing OV8858, f/2.4 |
| Battery | 2520 mAh (9.58Wh) |
| OS | OxygenOS/Android 5.1.1 Lollipop |
| Cellular Connectivity | 2G / 3G / 4G LTE (MDM9x25 Category 4) |
| Other Connectivity | 2.4GHz 802.11b/g/n + BT 4.0, microUSB 2.0, GNSS |
| SIM | Nano-SIM (Dual SIM SKU available) |
| Price | Onyx: 249 USD / 269 EUR Ceramic: 369 EUR |
On paper, the OnePlus X does look very similar to the original OnePlus One, but in a smaller form factor. What is probably the most intriguing aspect is the SoC, which is Qualcomm's MSM8974AB. This appears to be a confirmation that Snapdragon 801 can still be sourced, and it's interesting that only OnePlus has decided to utilize it despite the issues with Qualcomm's Snapdragon 808 and 810 SoCs. The OnePlus X uses the 2.3GHz version of Snapdragon 801 rather than the 2.45GHz MSM8974AC used in the OnePlus one, which likely won't have any significant impact in most cases but it's worth pointing out as one of the tiny differences between the two phones
The display is the same resolution as the OnePlus One and OnePlus Two, but with the OnePlus X it has gone down to a 5.0" size. With that also comes a switch from IPS LCD panels to a 1080p AMOLED panel, and it'll be interesting to see if the display has the same level of calibration as the OnePlus One did. The WiFi is strange in that it's advertised as WCN3680, which should be a single spatial stream 802.11ac implementation, but OnePlus only advertises support for 2.4GHz 802.11b/g/n.
While the rear-facing camera is the same resolution as the OnePlus One, it's explicitly stated to be an ISOCELL sensor which confirms that OnePlus has sourced their camera module from Samsung this time around rather than using Sony's IMX214 which was used in the OnePlus One. The front-facing camera gets a bump in resolution from 5MP to 8MP, and uses an Omnivision OV8858 sensor. The lens apertures aren't as wide as the f/2 apertures on the OnePlus One, which will have an impact on low-light shooting performance.
Beyond those changes the OnePlus X looks pretty much like a small OnePlus One as far as the specifications go. Obviously the chassis and display needed to scale down, as did the battery, but these are obvious changes going from a big phone to a smaller one.

The actual design and construction of the phone is a departure from OnePlus's existing industrial design. The OnePlus X drops the exposed plastic and textured back of the OnePlus One and Two, and instead aims for a design made of aluminum and glass. The standard version of the phone has flat metal edges that meet slightly curved glass on both sides, and to me the design looks much more impressive than OnePlus's previous offerings. The phone will also come in two versions, Onyx and Ceramic. The former simply means the black version, while the latter is actually made of ceramic, and also ends up being 22g heavier because of that. The ceramic model will only be sold in limited quantities, with 10,000 being made and sold in Europe and India.
The OnePlus X starts at 249 USD, which is significantly less than the 16GB model of the OnePlus 2 which costs 329 USD. While you definitely do lose a bit as far as specs goes, I actually find the smaller size and new design of the OnePlus X to be much more appealing than the OnePlus Two, and the lower price just makes that look like an even better deal. For anyone interested in buying the OnePlus X you'll still need to get an invite, and it'll be launching in Europe on November 5th for 269 EUR, or 369 EUR if you want the ceramic chassis. In the US the phone will be available on November 11th for 249 USD.
Read More ...
Available Tags:ASRock , Xeon , Motherboards ,
No comments:
Post a Comment